
MATLAB: An Introduction with Applications
6th Edition
ISBN: 9781119256830
Author: Amos Gilat
Publisher: John Wiley & Sons Inc
expand_more
expand_more
format_list_bulleted
Related questions
Concept explainers
Question

Transcribed Image Text:Chrome
File
Edit
View History Bookmarks
Profiles
Tab
Window
Help
Mon 8:42 PM
6 mycSUDH expire page
Content
b Answered: The standard devia
G how to screenshot on mac - G
+
A toro.csudh.edu/ultra/courses/_232477_1/cl/outline
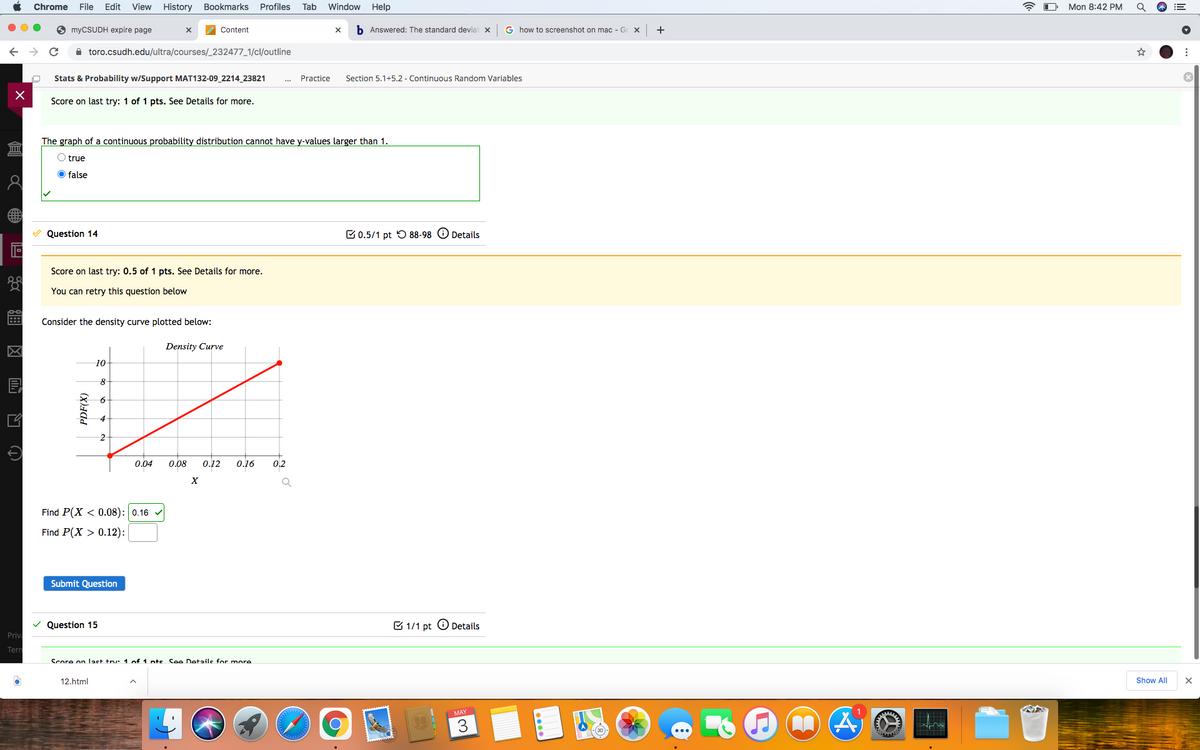
Stats & Probability w/Support MAT132-09_2214_23821
Practice
Section 5.1+5.2 - Continuous Random Variables
Score on last try: 1 of 1 pts. See Details for more.
The graph of a continuous probability distribution cannot have y-values larger than 1.
O true
O false
V Question 14
C 0.5/1 pt O 88-98 O Details
Score on last try: 0.5 of 1 pts. See Details for more.
You can retry this question below
Consider the density curve plotted below:
Density Curve
10
0.04
0.08
0.12
0.16
0.2
Find P(X < 0.08): 0.16
Find P(X > 0.12):
Submit Question
v Question 15
E 1/1 pt O Details
Priv
Terr
Score on Iact try: 1 f 1 nts See Details for more
12.html
Show All
MAY
PDF(X)
Expert Solution
This question has been solved!
Explore an expertly crafted, step-by-step solution for a thorough understanding of key concepts.

This is a popular solution

Trending nowThis is a popular solution!

Step by stepSolved in 2 steps with 1 images

Knowledge Booster


Learn more about
Need a deep-dive on the concept behind this application? Look no further. Learn more about this topic, statistics and related others by exploring similar questions and additional content below.Similar questions
- Very few of you attempted this fun problem! However, those few that did really hit the target! Congratulations to all of you that attempted this case study! The Life Insurance Case Study from Week 3 utilized the Z-score for Normal Distribution (Continuous Probability). (AKA Continuous Probability which is the Probability of AN event occurring). Let me walk you through this problem, step by step. The problem gives us 3 numbers The Mean/Average for this data set is 60% The data point of interest (X) is 64% (640 homes out of a sample of 1,000) - We are interested in understanding if At Least 64% of the homes (out of 1,000) purchased a Life Insurance Policy in the last year N = 1,000 Find the Standard Standard deviation of the Proportion. This is our 1st step because it is not provided = .0155 The Standard Deviation of the Sample Population is .0155 FInd the Z-score X = .64 U = .60 O = .0155 .64 - .60/.0155 = Z Z = 2.58 The 4th step is to find the Area of the Curve…arrow_forwardPlease help this is class workarrow_forwardAdobe PDF Signatures Paragraph Styles Editing Adobe Acrobat Voi 11. A pharmaceutical company makes tranquilizers. It is assumed that the distribution for the length of time they last is approximately normal. Researchers in a hospital used the drug on a random sample of 9 patients. The effective period of the tranquilizer for each patient (in hours) was as follows: 2.6; 2.8; 3.0; 2.3; 2.3; 2.2; 2.8; 2.1; and 2.4. Construct a 95% confidence interval for the population mean length of time. (i) State the confidence interval (Round your answer to two decimal places.) (ii) Calculate the error bound. (Round your answer to two decimal places.)arrow_forward
- Part 1 A population of values has a normal distribution with mean of 50.6 and standard deviation of 98.9. a) Get the z-score for a value of 44. For this problem you use the z score formula b) This z-score tells you how many the score of 44 is above or below the population mean u. c) Find the probability that a randomly selected value is less than 44.arrow_forwardHelp please!arrow_forwardHelp please with section (a).it has 3 partsarrow_forward
arrow_back_ios
arrow_forward_ios
Recommended textbooks for you
- MATLAB: An Introduction with ApplicationsStatisticsISBN:9781119256830Author:Amos GilatPublisher:John Wiley & Sons Inc
 Probability and Statistics for Engineering and th...StatisticsISBN:9781305251809Author:Jay L. DevorePublisher:Cengage Learning
 Statistics for The Behavioral Sciences (MindTap C...StatisticsISBN:9781305504912Author:Frederick J Gravetter, Larry B. WallnauPublisher:Cengage Learning
  Elementary Statistics: Picturing the World (7th E...StatisticsISBN:9780134683416Author:Ron Larson, Betsy FarberPublisher:PEARSON
 The Basic Practice of StatisticsStatisticsISBN:9781319042578Author:David S. Moore, William I. Notz, Michael A. FlignerPublisher:W. H. Freeman
 Introduction to the Practice of StatisticsStatisticsISBN:9781319013387Author:David S. Moore, George P. McCabe, Bruce A. CraigPublisher:W. H. Freeman
MATLAB: An Introduction with Applications
Statistics
ISBN:9781119256830
Author:Amos Gilat
Publisher:John Wiley & Sons Inc
Probability and Statistics for Engineering and th...
Statistics
ISBN:9781305251809
Author:Jay L. Devore
Publisher:Cengage Learning
Statistics for The Behavioral Sciences (MindTap C...
Statistics
ISBN:9781305504912
Author:Frederick J Gravetter, Larry B. Wallnau
Publisher:Cengage Learning
Elementary Statistics: Picturing the World (7th E...
Statistics
ISBN:9780134683416
Author:Ron Larson, Betsy Farber
Publisher:PEARSON
The Basic Practice of Statistics
Statistics
ISBN:9781319042578
Author:David S. Moore, William I. Notz, Michael A. Fligner
Publisher:W. H. Freeman
Introduction to the Practice of Statistics
Statistics
ISBN:9781319013387
Author:David S. Moore, George P. McCabe, Bruce A. Craig
Publisher:W. H. Freeman