
MATLAB: An Introduction with Applications
6th Edition
ISBN: 9781119256830
Author: Amos Gilat
Publisher: John Wiley & Sons Inc
expand_more
expand_more
format_list_bulleted
Related questions
Question
thumb_up100%
STATISTICS (THUMBS UP WILL BE GIVEN. PLEASE WRITE THE COMPLETE SOLUTION. DO NOT USE EXCEL OR SOFTWARE. DO NOT SHORTCUT. MANUAL COMPUTATIONS NEEDED. SEE THE ATTACHED IMAGE FOR THE AREAS UNDER NORMAL CURVE IF NECESSARY)
On a Math test the class mean was 63 and the standard deviation was 7 and for the biology test the mean was 23 and has a standard deviation of 3.9.
(a). Find the z-score for each score. (b). Determine which test the student had a better score of the following:
a. A student received a 73 on the statistics test and a 26 on the biology test.
b. A student gets a 60 on the statistical tests and a 20 on the biology test.
c. A student gets a 78 on the statistics test and a 29 on the biology test.
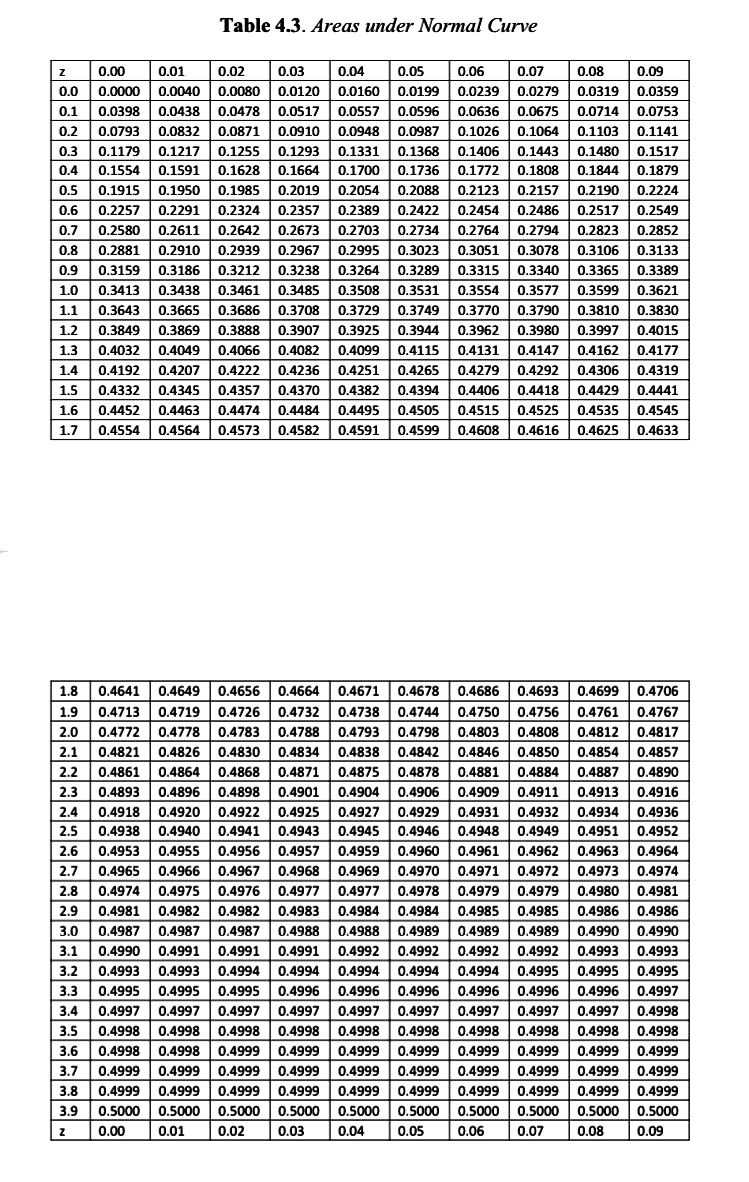

Transcribed Image Text:Table 4.3. Areas under Normal Curve
Z
0.01
0.04
0.1141
0.1517
0.1879
0.2224
0.00
0.02 0.03
0.05 0.06 0.07 0.08 0.09
0.0 0.0000 0.0040 0.0080 0.0120 0.0160 0.0199 0.0239 0.0279 0.0319 0.0359
0.1 0.0398 0.0438 0.0478 0.0517 0.0557 0.0596 0.0636 0.0675 0.0714 0.0753
0.2 0.0793 0.0832 0.0871 0.0910 0.0948 0.0987 0.1026 0.1064 0.1103
0.3 0.1179 0.1217 0.1255 0.1293 0.1331 0.1368 0.1406 0.1443 0.1480
0.4 0.1554 0.1591 0.1628 0.1664 0.1700 0.1736 0.1772 0.1808 0.1844
0.5 0.1915 0.1950 0.1985 0.2019
0.2054 0.2088 0.2123 0.2157 0.2190
0.6 0.2257 0.2291 0.2324 0.2357
0.2389
0.2422 0.2454
0.7 0.2580 0.2611 0.2642 0.2673 0.2703 0.2734 0.2764 0.2794 0.2823 0.2852
0.8 0.2881 0.2910 0.2939 0.2967 0.2995 0.3023 0.3051 0.3078 0.3106 0.3133
0.9 0.3159 0.3186 0.3212 0.3238 0.3264 0.3289 0.3315 0.3340 0.3365 0.3389
1.0 0.3413 0.3438 0.3461 0.3485 0.3508 0.3531 0.3554 0.3577 0.3599 0.3621
1.1 0.3643 0.3665 0.3686 0.3708
0.3749 0.3770 0.3790 0.3810
0.3944 0.3962 0.3980 0.3997
0.2486 0.2517 0.2549
0.3729
0.3830
1.2
0.3849
0.3869
0.3888
0.3907
0.4015
0.4049
0.4066
0.4082
0.4131 0.4147 0.4162
0.4177
0.3925
0.4099 0.4115
0.4222 0.4236 0.4251 0.4265
0.4357 0.4370 0.4382 0.4394
0.4279 0.4292 0.4306
1.3 0.4032
1.4 0.4192 0.4207
1.5 0.4332 0.4345
0.4406 0.4418 0.4429
1.6 0.4452 0.4463 0.4474 0.4484 0.4495 0.4505 0.4515 0.4525 0.4535 0.4545
1.7 0.4554 0.4564 0.4573 0.4582 0.4591 0.4599 0.4608 0.4616 0.4625 0.4633
0.4319
0.4441
0.4890
1.8 0.4641 0.4649 0.4656 0.4664 0.4671 0.4678 0.4686 0.4693 0.4699 0.4706
1.9 0.4713 0.4719 0.4726 0.4732 0.4738 0.4744 0.4750 0.4756 0.4761 0.4767
2.0 0.4772 0.4778 0.4783 0.4788 0.4793 0.4798 0.4803 0.4808 0.4812 0.4817
2.1 0.4821 0.4826 0.4830 0.4834 0.4838
0.4838 0.4842 0.4846 0.4850 0.4854 0.4857
2.2 0.4861 0.4864 0.4868 0.4871 0.4875 0.4878 0.4881 0.4884 0.4887
2.3 0.4893 0.4896 0.4898 0.4901 0.4904 0.4906 0.4909 0.4911 0.4913 0.4916
2.4 0.4918 0.4920 0.4922 0.4925 0.4927 0.4929 0.4931 0.4932 0.4934 0.4936
2.5 0.4938 0.4940 0.4941 0.4943 0.4945 0.4946 0.4948 0.4949 0.4951 0.4952
2.6 0.4953 0.4955 0.4956 0.4957 0.4959 0.4960 0.4961 0.4962 0.4963 0.4964
2.7 0.4965 0.4966
0.4967 0.4968 0.4969 0.4970 0.4971 0.4972 0.4973 0.4974
2.8 0.4974 0.4975 0.4976 0.4977 0.4977 0.4978 0.4979 0.4979 0.4980 0.4981
2.9 0.4981 0.4982 0.4982 0.4983 0.4984 0.4984 0.4985 0.4985 0.4986
0.4986
3.0 0.4987 0.4987 0.4987 0.4988 0.4988 0.4989 0.4989 0.4989 0.4990
3.1 0.4990 0.4991 0.4991 0.4991 0.4992 0.4992 0.4992 0.4992 0.4993
3.2 0.4993 0.4993 0.4994 0.4994 0.4994 0.4994 0.4994 0.4995 0.4995
3.3 0.4995 0.4995 0.4995 0.4996 0.4996 0.4996 0.4996 0.4996 0.4996
0.4997
3.4 0.4997 0.4997 0.4997 0.4997 0.4997 0.4997 0.4997 0.4997 0.4997 0.4998
0.4998 0.4998 0.4998
0.4998 0.4998 0.4998 0.4998 0.4998 0.4998 0.4998
3.6 0.4998 0.4998 0.4999 0.4999 0.4999 0.4999 0.4999 0.4999 0.4999 0.4999
3.7 0.4999 0.4999 0.4999 0.4999 0.4999 0.4999 0.4999 0.4999 0.4999 0.4999
3.8 0.4999 0.4999 0.4999 0.4999 0.4999 0.4999 0.4999 0.4999 0.4999 0.4999
3.9 0.5000 0.5000 0.5000 0.5000 0.5000 0.5000 0.5000 0.5000 0.5000 0.5000
Z
0.00 0.01 0.02 0.03 0.04 0.05
0.4990
0.4993
0.4995
3.5
0.06
0.07
0.08
0.09
Expert Solution
This question has been solved!
Explore an expertly crafted, step-by-step solution for a thorough understanding of key concepts.

Step by stepSolved in 2 steps

Knowledge Booster

Similar questions
- Determine whether the data are qualitative or quantitative. Cholesterol counts for individuals O Qualitative O Quantitativearrow_forwardI need help with instructions to on how to identify which box plots corresponds with each histogram. It’s more confusing bc there’s no numbers to calculate for a median , etc.arrow_forwardAugusta National Golf Course. Earlier in this section, we found that the population mean length of the holes at the Augusta National Golf Club is 413.1 yd. In this context, is the number 413.1 a parameter or a statistic? Explain your answer.arrow_forward
- please answer A and B thank you.arrow_forwardCopy and paste an image of your table with data for Patients 1 and 2 in the space provided below. This image should include the calculated values for Mean and Std Dev. Compare the values for Mean and Std Dev for the two patients. Did both patients meet the requirements for an average of 1800.0 Calories per day? Explain in your own words your interpretation of the Std Dev values for the two sets of patient data.arrow_forwardCan someone please help? Thank you.arrow_forward
- Use the birth weights (grams) of 50 babies from the data set "Births." Use software or a calculator to find the mean and median. Examine the list of birth weights to make an observation about those numbers. How does that observation affect the way that the results should be rounded? Click the icon to view the birth weight data. - X The mean birth weight is Birth weights (grams) grams. (Round to one decimal place as needed.) 300 4900 4000 3600 3400 3000 3700 2900 3700 3100 3400 3500 4100 3200 2900 2800 3500 3100 3300 3800 3800 2300 3300 2600 2400 3400 3300 4000 2800 3600 3100 2800 2800 2500 2600 2700 2600 3000 2900 3600 300 3400 3500 3400 3600 3400 3200 2600 3600 3500arrow_forwardshow work/explain pleasearrow_forwardWhy is the answer not a Median but its neither Median or Altitude?arrow_forward
- Please provide a correct answer with a full method explanation and do not copy and paste from other similar questions. This question is multiple choice so please give me a correct answer from the given five options.arrow_forwardThe list shows the score of each game completed at a bowling alley during a one-hour period. 90, 96, 120, 124, 130, 135, 138, 140, 145, 148, 290, 290 Would the mode of the data be an informative measure of center in this situation? Explain your answer.arrow_forwardHi I need help with the last part please thank youarrow_forward
arrow_back_ios
SEE MORE QUESTIONS
arrow_forward_ios
Recommended textbooks for you
- MATLAB: An Introduction with ApplicationsStatisticsISBN:9781119256830Author:Amos GilatPublisher:John Wiley & Sons Inc
 Probability and Statistics for Engineering and th...StatisticsISBN:9781305251809Author:Jay L. DevorePublisher:Cengage Learning
 Statistics for The Behavioral Sciences (MindTap C...StatisticsISBN:9781305504912Author:Frederick J Gravetter, Larry B. WallnauPublisher:Cengage Learning
  Elementary Statistics: Picturing the World (7th E...StatisticsISBN:9780134683416Author:Ron Larson, Betsy FarberPublisher:PEARSON
 The Basic Practice of StatisticsStatisticsISBN:9781319042578Author:David S. Moore, William I. Notz, Michael A. FlignerPublisher:W. H. Freeman
 Introduction to the Practice of StatisticsStatisticsISBN:9781319013387Author:David S. Moore, George P. McCabe, Bruce A. CraigPublisher:W. H. Freeman
MATLAB: An Introduction with Applications
Statistics
ISBN:9781119256830
Author:Amos Gilat
Publisher:John Wiley & Sons Inc
Probability and Statistics for Engineering and th...
Statistics
ISBN:9781305251809
Author:Jay L. Devore
Publisher:Cengage Learning
Statistics for The Behavioral Sciences (MindTap C...
Statistics
ISBN:9781305504912
Author:Frederick J Gravetter, Larry B. Wallnau
Publisher:Cengage Learning
Elementary Statistics: Picturing the World (7th E...
Statistics
ISBN:9780134683416
Author:Ron Larson, Betsy Farber
Publisher:PEARSON
The Basic Practice of Statistics
Statistics
ISBN:9781319042578
Author:David S. Moore, William I. Notz, Michael A. Fligner
Publisher:W. H. Freeman
Introduction to the Practice of Statistics
Statistics
ISBN:9781319013387
Author:David S. Moore, George P. McCabe, Bruce A. Craig
Publisher:W. H. Freeman