
MATLAB: An Introduction with Applications
6th Edition
ISBN: 9781119256830
Author: Amos Gilat
Publisher: John Wiley & Sons Inc
expand_more
expand_more
format_list_bulleted
Related questions
Question

Transcribed Image Text:五
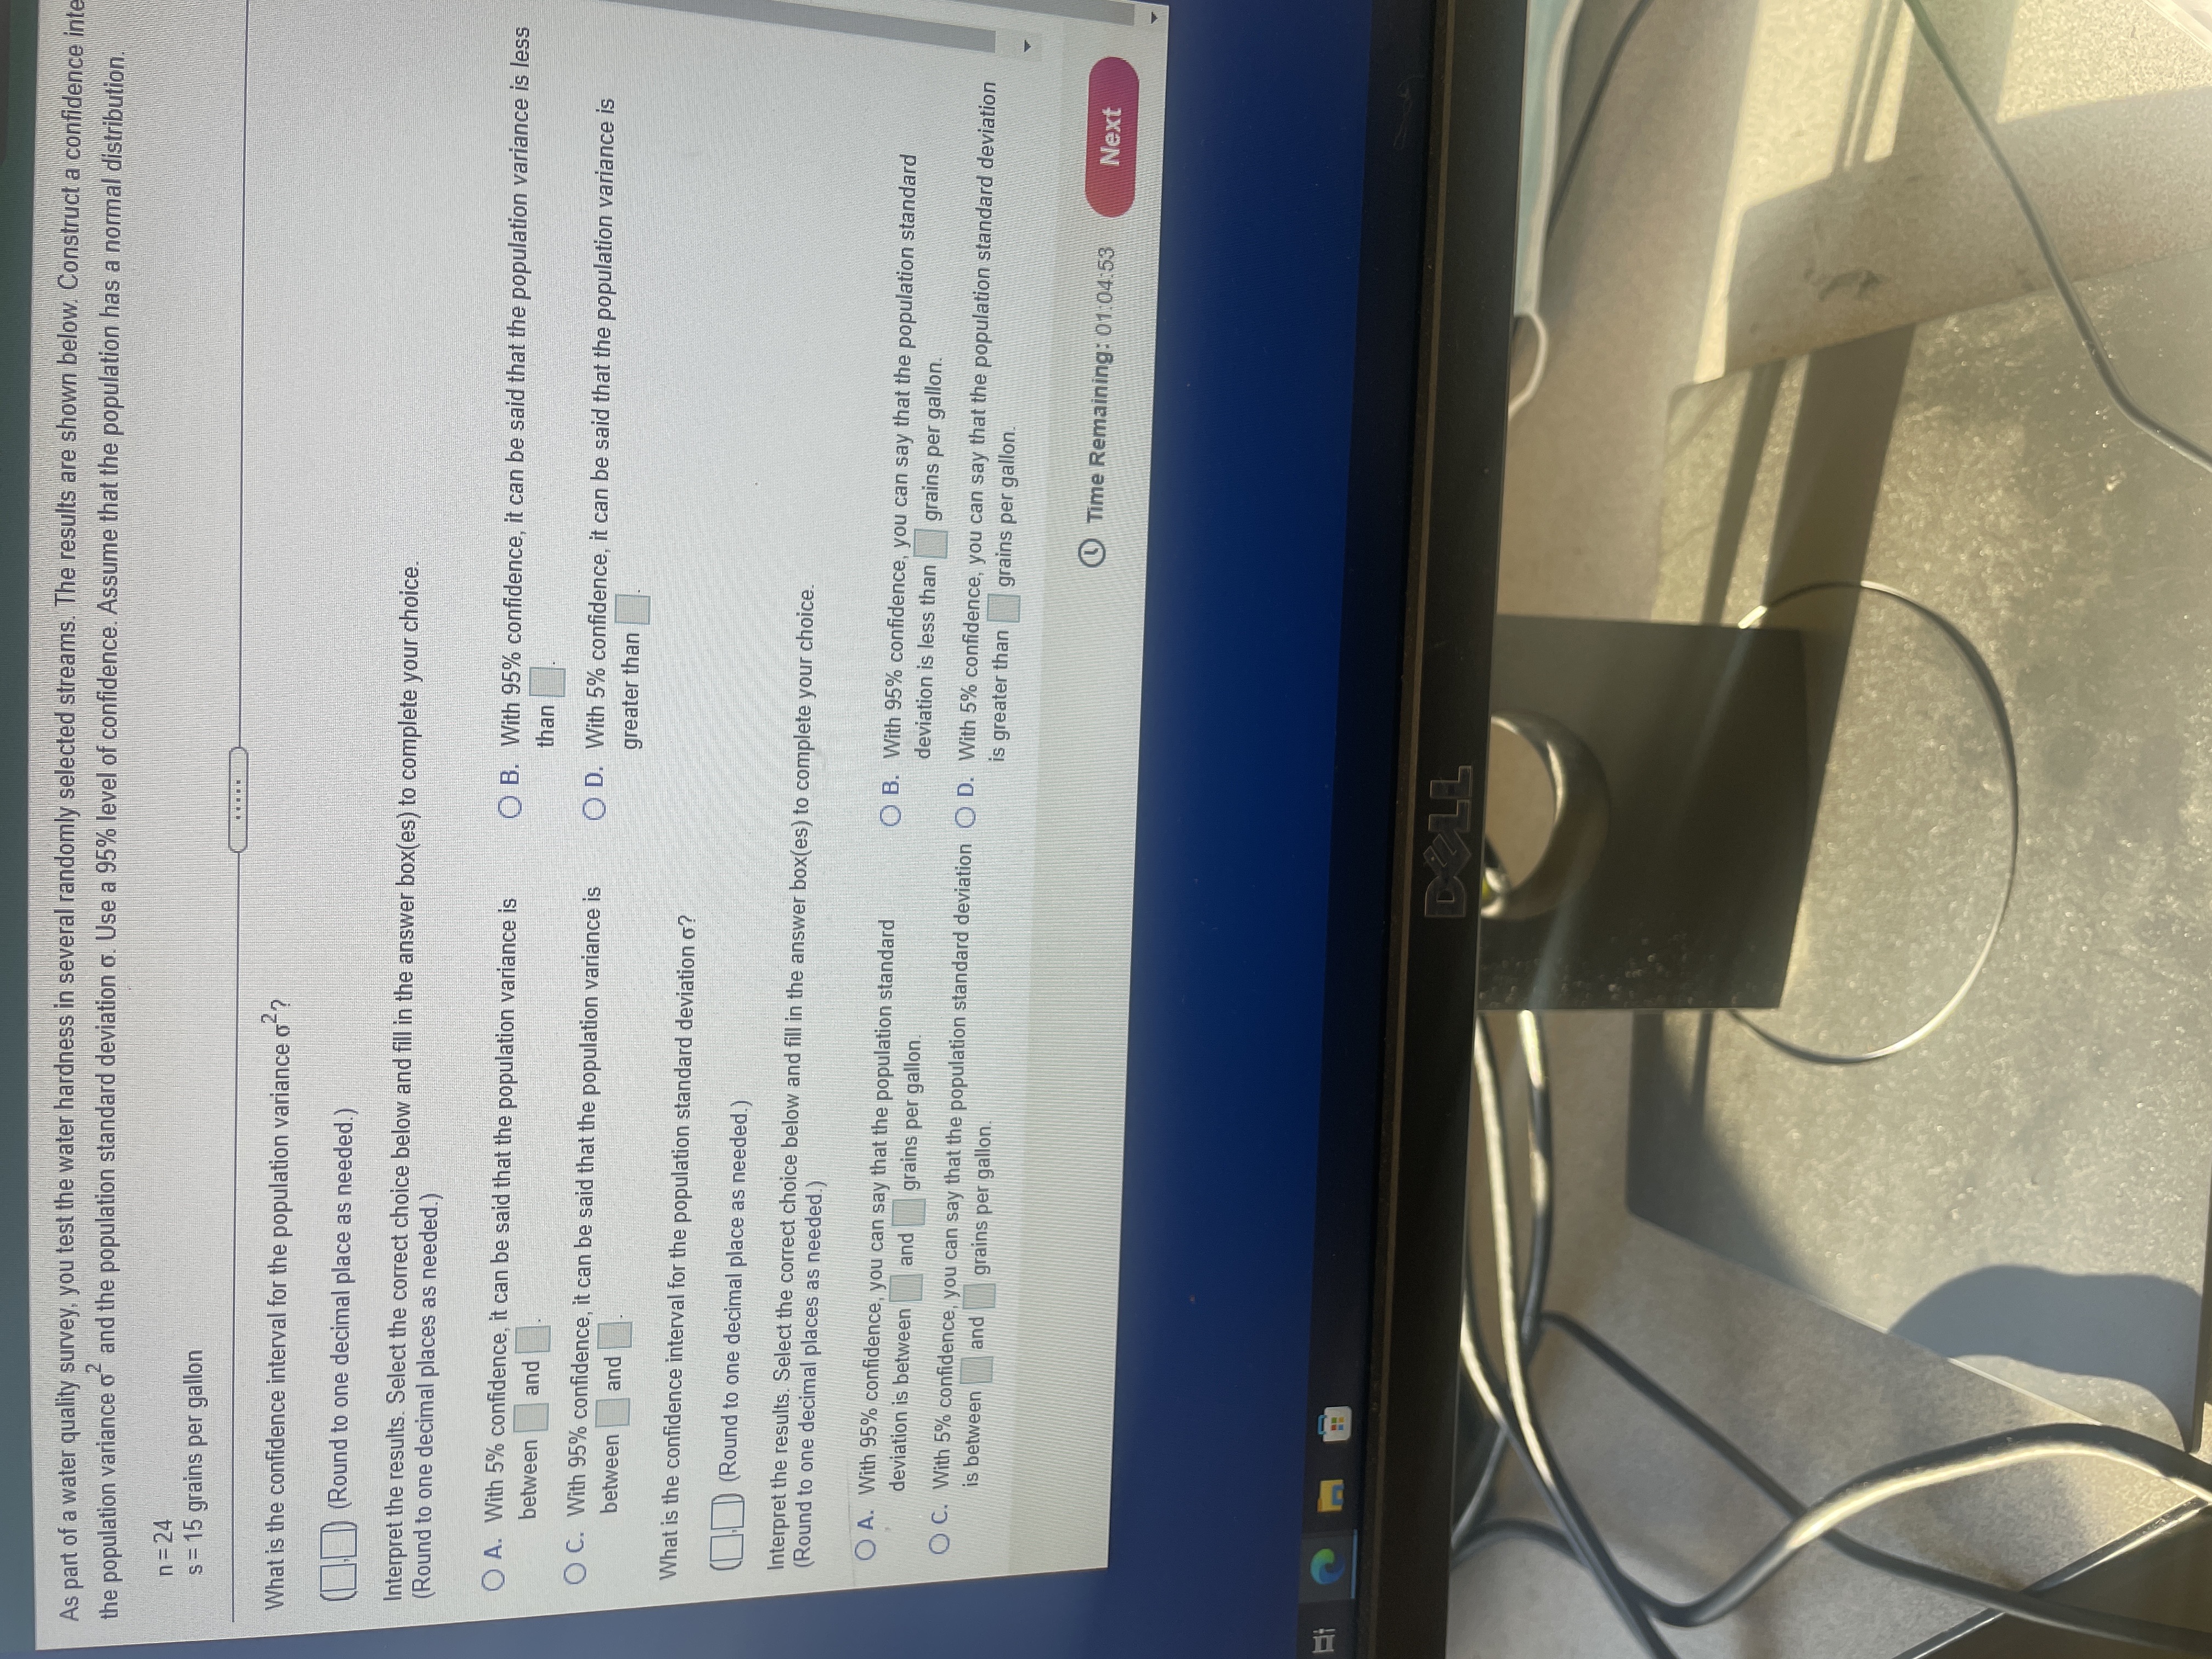
As part of a water quality survey,. you test the water hardness in several randomly selected streams. The results are shown below. Construct a confidence inte
and the population standard deviation o. Use a 95% level of confidence. Assume that the population has a normal distribution.
n=24
s= 15 grains per gallon
....D
What is the confidence interval for the population variance o ?
| | D (Round to one decimal place as needed.)
Interpret the results. Select the correct choice below and fill in the answer box(es) to complete your choice.
(Round to one decimal places as needed.)
O A. With 5% confidence, it can be said that the population variance is
O B. With 95% confidence, it can be said that the population variance is less
between
than
pue
OC. With 95% confidence, it can be said that the population variance is
O D. With 5% confidence, it can be said that the population variance is
between
greater than
pue
What is the confidence interval for the population standard deviation o?
CHD (Round to one decimal place as needed.
Interpret the results. Select the correct choice below and fill in the answer box(es) to complete your choice.
(Round to one decimal places as needed.)
OA. With 95% confidence, you can say that the population standard
O B. With 95% confidence, you can say that the population standard
deviation is between
pue
grains per gallon.
deviation is less than
grains per gallon.
OC. With 5% confidence, you can say that the population standard deviation O D. With 5% confidence, you can say that the population standard deviation
is between
and
grains per gallon.
is greater than
grains per gallon.
O Time Remaining: 01:04:53
Next
Expert Solution
This question has been solved!
Explore an expertly crafted, step-by-step solution for a thorough understanding of key concepts.

Step by stepSolved in 3 steps with 4 images

Knowledge Booster

Similar questions
- PLEASE SHOW WORK.arrow_forwardHi, can i get help on subsections D and E found on the question below please. Suppose that a category of world class runners are known to run a Spartathlon, a 246-kilometer (153 mi) ultramarathon race in an average of 26 hours with a standard deviation of 3 hours. Consider 36 of the races. Let X the average of the 36 races. Explain or show work for all part of the question. A. In words, X = %3D B. X ~ L ) C. Find the 1QR for the average finishing time in these 36 races. D. Find the probability that the runner will average in under 24 hours in these 36 races. E. How many races should be considered if we want the standard deviation of X to be half (1.5 hours) of the standard deviation given in the problem.arrow_forwardPLEASE SHOW WORK..arrow_forward
- Select the most appropriate answer. The prediction error for an observation, which is the difference between the actual value and the predicted value of the response variable, is called O a residual O a correlation O an outlier O an extrapolationarrow_forwardCereals sodium values have a mean of 167 and a standard deviation of 77.3. Find the z-score for the cereal that has a sodium value of 0. How would you interpret this z-score?arrow_forwardPlz help asap t7.arrow_forward
- A mean function E(Y IX = x) tells us: the probability of observing the value Y. O whether or not to reject the null hypothesis. how much data we need to collect. how the expected value of Y changes as X varies.arrow_forwardThe time to complete an exam is approximately Normal with a mean of 45 minutes and a standard deviation of 4 minutes. The bell curve below represents the distribution for testing times. The scale on the horizontal axis is equal to the standard deviation. Fill in the indicated boxes.. μ-20 μισ μ-36 μ-20 μ μ+o μ=45 σ = 4 μ+20 μ+30arrow_forwardRefer to the data set in the accompanying table. Assume that the paired sample data is a simple random sample and the differences have a distribution that is approximately normal. Use a significance level of 0.05 to test for a difference between the weights of discarded paper (in pounds) and weights of discarded plastic (in pounds). LOADING... Click the icon to view the data. In this example, μd is the mean value of the differences d for the population of all pairs of data, where each individual difference d is defined as the weight of discarded paper minus the weight of discarded plastic for a household. What are the null and alternative hypotheses for the hypothesis test? A. H0: μd≠0 H1: μd>0 B. H0: μd=0 H1: μd<0 C. H0: μd=0 H1: μd≠0 D. H0: μd≠0 H1: μd=0 Household Paper Plastic 1 6.44 8.40 2 7.72 3.86 3 3.27 0.63 4 9.19 3.74 5 14.33 6.43 6 11.08 12.47 7…arrow_forward
arrow_back_ios
arrow_forward_ios
Recommended textbooks for you
- MATLAB: An Introduction with ApplicationsStatisticsISBN:9781119256830Author:Amos GilatPublisher:John Wiley & Sons Inc
 Probability and Statistics for Engineering and th...StatisticsISBN:9781305251809Author:Jay L. DevorePublisher:Cengage Learning
 Statistics for The Behavioral Sciences (MindTap C...StatisticsISBN:9781305504912Author:Frederick J Gravetter, Larry B. WallnauPublisher:Cengage Learning
  Elementary Statistics: Picturing the World (7th E...StatisticsISBN:9780134683416Author:Ron Larson, Betsy FarberPublisher:PEARSON
 The Basic Practice of StatisticsStatisticsISBN:9781319042578Author:David S. Moore, William I. Notz, Michael A. FlignerPublisher:W. H. Freeman
 Introduction to the Practice of StatisticsStatisticsISBN:9781319013387Author:David S. Moore, George P. McCabe, Bruce A. CraigPublisher:W. H. Freeman
MATLAB: An Introduction with Applications
Statistics
ISBN:9781119256830
Author:Amos Gilat
Publisher:John Wiley & Sons Inc
Probability and Statistics for Engineering and th...
Statistics
ISBN:9781305251809
Author:Jay L. Devore
Publisher:Cengage Learning
Statistics for The Behavioral Sciences (MindTap C...
Statistics
ISBN:9781305504912
Author:Frederick J Gravetter, Larry B. Wallnau
Publisher:Cengage Learning
Elementary Statistics: Picturing the World (7th E...
Statistics
ISBN:9780134683416
Author:Ron Larson, Betsy Farber
Publisher:PEARSON
The Basic Practice of Statistics
Statistics
ISBN:9781319042578
Author:David S. Moore, William I. Notz, Michael A. Fligner
Publisher:W. H. Freeman
Introduction to the Practice of Statistics
Statistics
ISBN:9781319013387
Author:David S. Moore, George P. McCabe, Bruce A. Craig
Publisher:W. H. Freeman