
MATLAB: An Introduction with Applications
6th Edition
ISBN: 9781119256830
Author: Amos Gilat
Publisher: John Wiley & Sons Inc
expand_more
expand_more
format_list_bulleted
Related questions
Question

Transcribed Image Text:%24
|x – x3
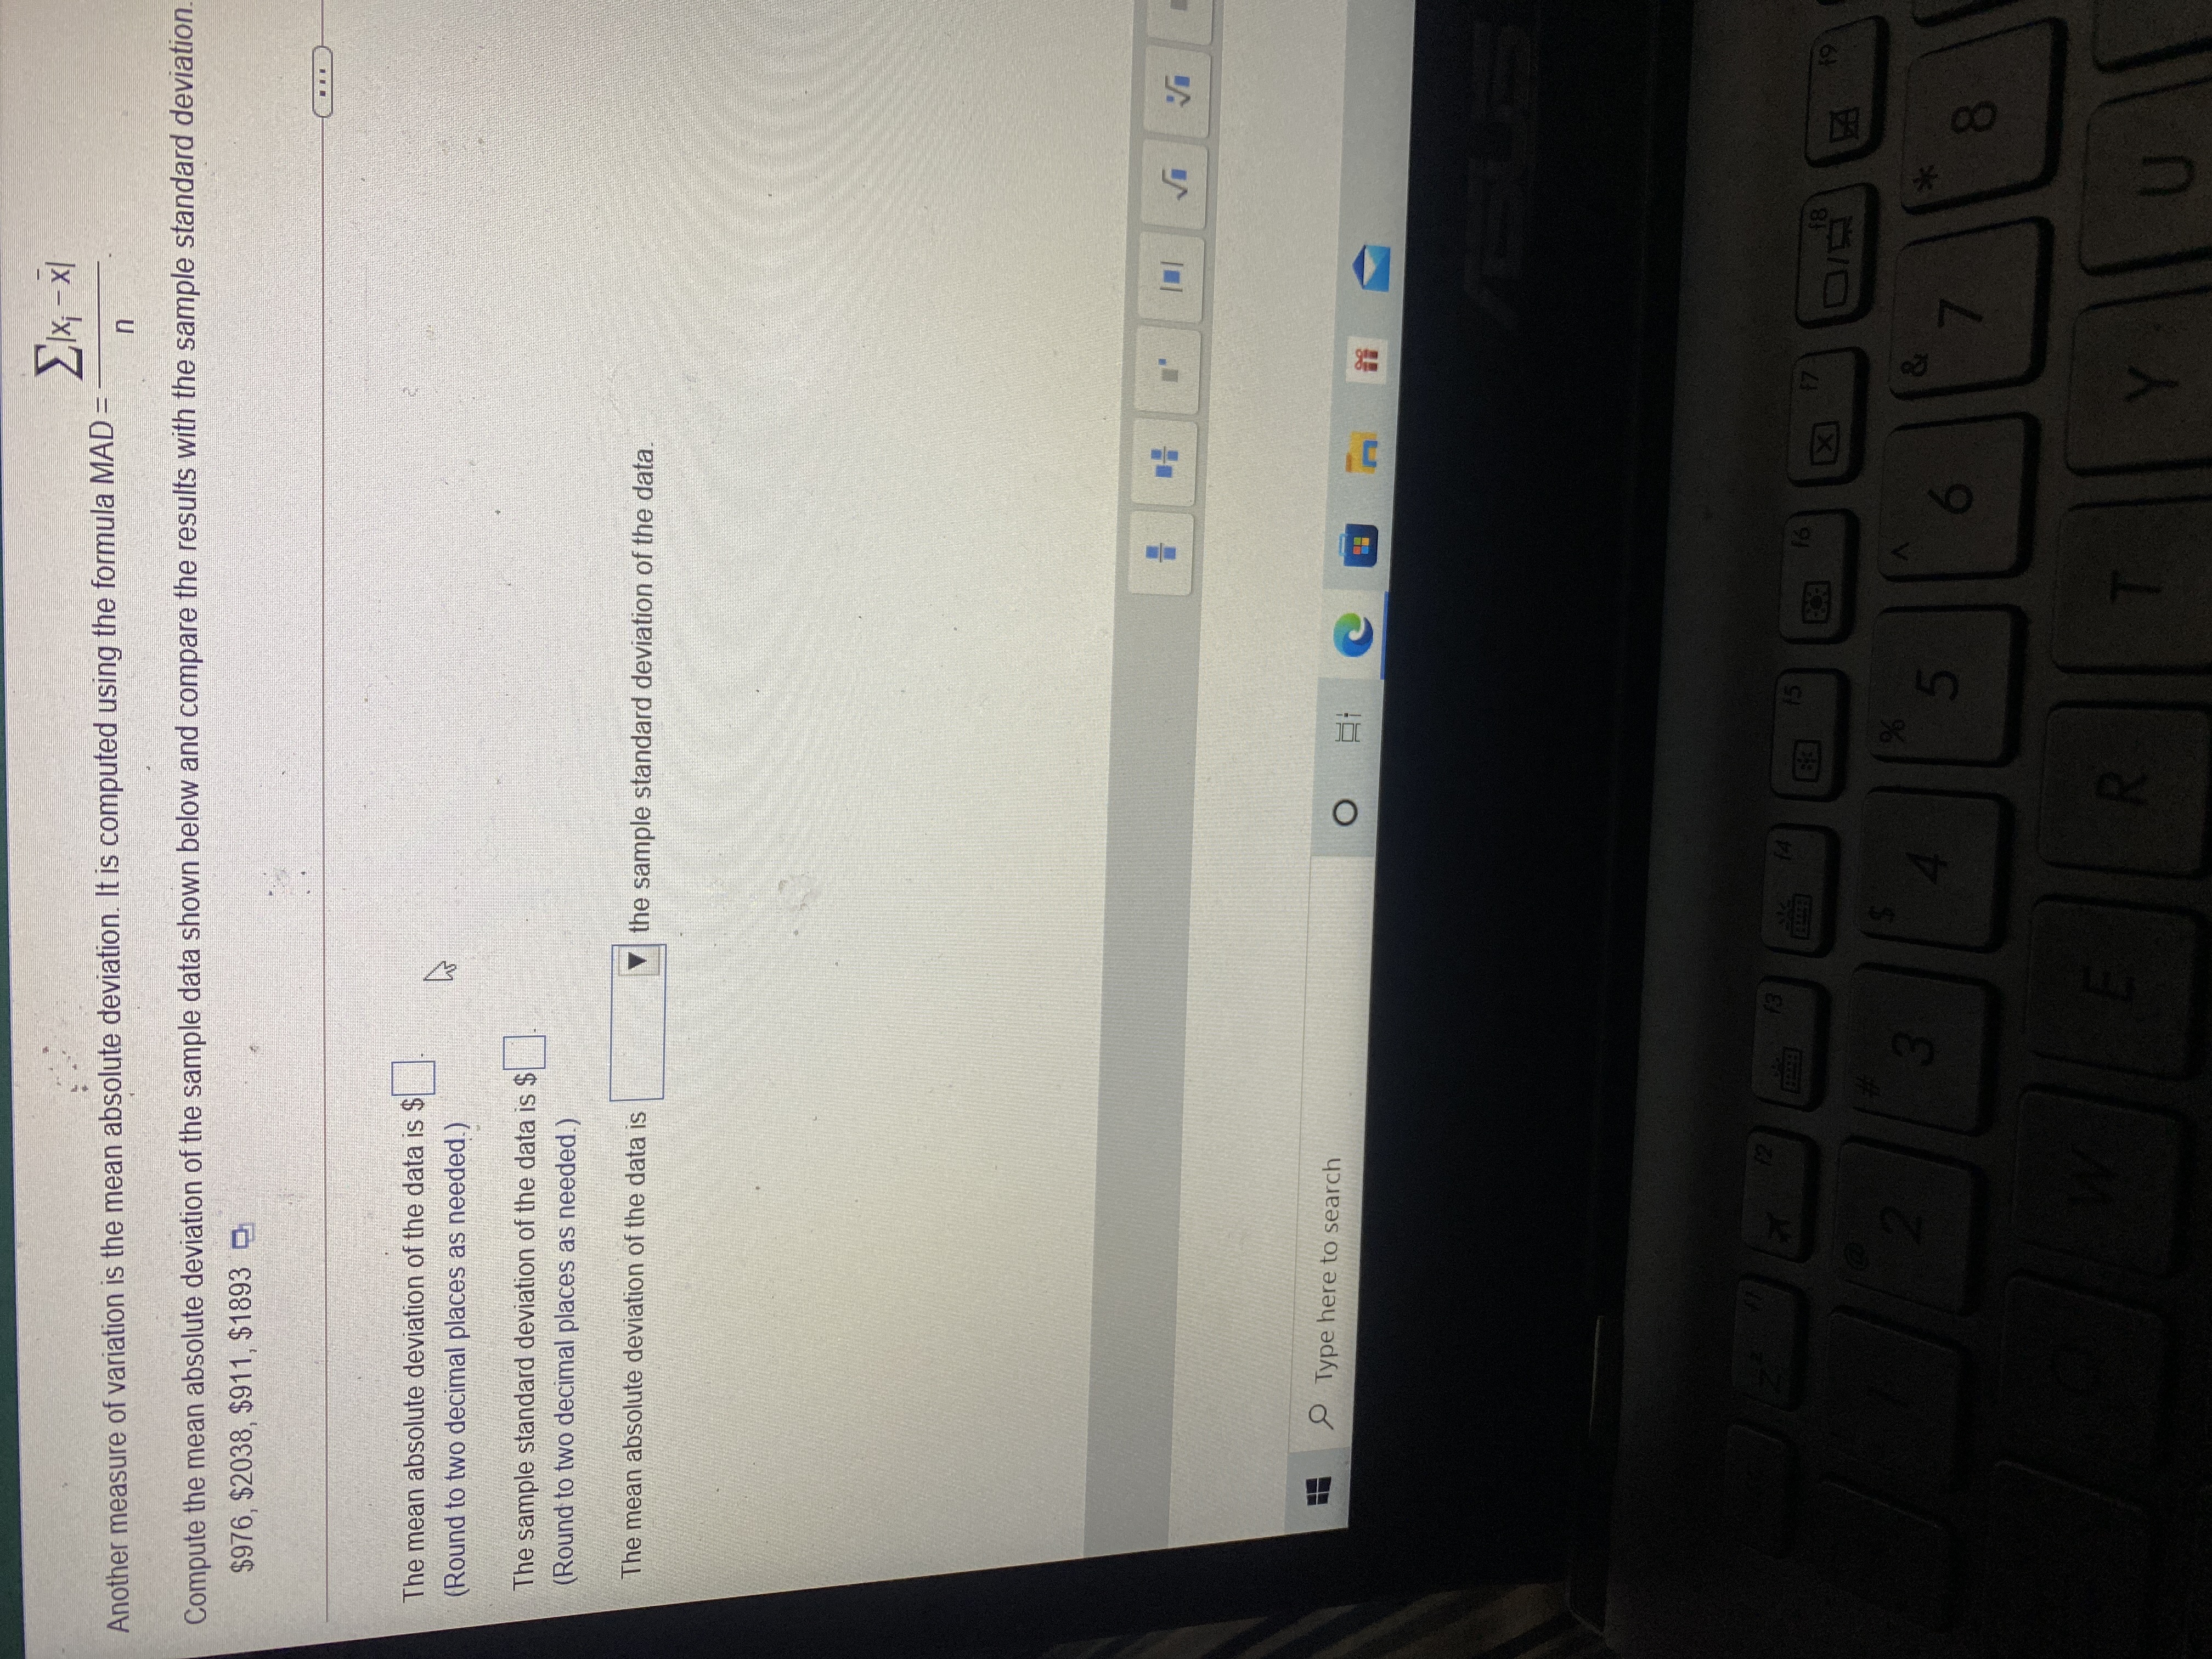
Another measure of variation is the mean absolute deviation. It is computed using the formula MAD =
Compute the mean absolute deviation of the sample data shown below and compare the results with the sample standard deviation.
$976, $2038, $911, $1893
The mean absolute deviation of the data is $
(Round to two decimal places as needed.)
The sample standard deviation of the data is $
(Round to two decimal places as needed.)
The mean absolute deviation of the data is
the sample standard deviation of the data.
Type here to search
15
18
LEGO
91
X
61
Expert Solution
This question has been solved!
Explore an expertly crafted, step-by-step solution for a thorough understanding of key concepts.

This is a popular solution

Trending nowThis is a popular solution!

Step by stepSolved in 3 steps with 2 images

Knowledge Booster

Similar questions
- For the data in the table, find the mean and the median of the monthly high temperatures. Then do the same for the monthly low temperatures. The mean of the high temperatures is ______F (type an integer or a decimal.) Month High low Jan 17 8 Feb 23 13 Mar 30 19 Temperatures are in degrees fahrenheit Apr 41 28 May 54 43arrow_forwardone z-score unit is equivalent to ______ of the distribution. a. the variance b. the range c. the standard deviation d. the mean e. the correlation coefficientarrow_forwardThe scores and their percent of the final grade for a statistics student are given. What is the student's weighted mean score? The student's weighted mean score is (Simplify your answer. Round to two decimal places as needed.) Homework Quiz Quiz Project Final Exam Score Percent of final grade 86 10 83 10 98 10 98 40 89 30arrow_forward
- ❎❎❎❎✅✅✅✅✅✅✅arrow_forwardfind the mean, median, and range of the set of numbers. Then, use Excel to create a frequency table and a histogram of the test scores. Make sure to label your tables and graphs appropriately A researcher is studying reaction times in mice. The reaction times in milliseconds (ms) for thirty mice are shown below. 66 384 539 578 166 741 874 384 221 178 176 675 275 15 845 397 271 655 681 702 63 823 364 194 755 744 557 776 69 857arrow_forwardUsing this data, find the variance for between subjects. Round your final answer to the nearest 2 decimal places. 0 Tacos 2 Tacos 4 Tacos 8 Tacos 10 Tacos 12 Tacos Jack 52 62 75 85 91 84 Jane 53 67 71 79 91 86 Jeff 55 99 69 79 54 65 Dr. Chu decided to conduct a study on the effects of the amount of tacos eaten per week and one's score on their final exam for STATS 101. The data is presented above.arrow_forward
- Find the mean, median, and mode(s) of the data in the following stem-and-leaf plot. The leaf represents the ones digit. 09 1 59 2 6788 1 Part 1 of 3 Find the mean. Round your answer to one decimal place, if necessary. Mean: S Part 2 of 3 Find the median. Round your answer to one decimal place, if necessary. Median: X Sarrow_forwardFind the mean of the data summarized in the given frequency distribution. Compare the computed mean to the actual mean of 51.9 miles per hour. Speed (miles per hour) Frequency 42 - 45 46-49 50 - 53 54 -57 58 -61 25 15 The mean of the frequency distribution is miles per hour. (Round to the nearest tenth as needed.)arrow_forwardThe data below represents the number of T-shirts sold per week by a student who started his own online T-shirt business. Find the mean number of T-shirts sold per week. (Round your answer to the nearest tenth if necessary.) T-Shirts Sold per Week Frequency 4 3 8 2 12 4 16 6arrow_forward
- Determine the mean of the data.arrow_forwardFind the mean of the data summarized in the given frequency distribution. The test scores of 40 students are summarized in the frequency distribution below. Find the mean score. Score Students 50-59 60-69 70-79 80-89 90-99 57728 12arrow_forwardCalculate the mean, variance, and standard deviation of following "Population" data: 96,65,64,95, and 95. Round to two decimal places as needed Click this video to learn more about the formula 96 65 64 95 95 X x-μ (x-μ)² THE C Mean Variance Standard Deviationarrow_forward
arrow_back_ios
arrow_forward_ios
Recommended textbooks for you
- MATLAB: An Introduction with ApplicationsStatisticsISBN:9781119256830Author:Amos GilatPublisher:John Wiley & Sons Inc
 Probability and Statistics for Engineering and th...StatisticsISBN:9781305251809Author:Jay L. DevorePublisher:Cengage Learning
 Statistics for The Behavioral Sciences (MindTap C...StatisticsISBN:9781305504912Author:Frederick J Gravetter, Larry B. WallnauPublisher:Cengage Learning
  Elementary Statistics: Picturing the World (7th E...StatisticsISBN:9780134683416Author:Ron Larson, Betsy FarberPublisher:PEARSON
 The Basic Practice of StatisticsStatisticsISBN:9781319042578Author:David S. Moore, William I. Notz, Michael A. FlignerPublisher:W. H. Freeman
 Introduction to the Practice of StatisticsStatisticsISBN:9781319013387Author:David S. Moore, George P. McCabe, Bruce A. CraigPublisher:W. H. Freeman
MATLAB: An Introduction with Applications
Statistics
ISBN:9781119256830
Author:Amos Gilat
Publisher:John Wiley & Sons Inc
Probability and Statistics for Engineering and th...
Statistics
ISBN:9781305251809
Author:Jay L. Devore
Publisher:Cengage Learning
Statistics for The Behavioral Sciences (MindTap C...
Statistics
ISBN:9781305504912
Author:Frederick J Gravetter, Larry B. Wallnau
Publisher:Cengage Learning
Elementary Statistics: Picturing the World (7th E...
Statistics
ISBN:9780134683416
Author:Ron Larson, Betsy Farber
Publisher:PEARSON
The Basic Practice of Statistics
Statistics
ISBN:9781319042578
Author:David S. Moore, William I. Notz, Michael A. Fligner
Publisher:W. H. Freeman
Introduction to the Practice of Statistics
Statistics
ISBN:9781319013387
Author:David S. Moore, George P. McCabe, Bruce A. Craig
Publisher:W. H. Freeman