
MATLAB: An Introduction with Applications
6th Edition
ISBN: 9781119256830
Author: Amos Gilat
Publisher: John Wiley & Sons Inc
expand_more
expand_more
format_list_bulleted
Related questions
Question
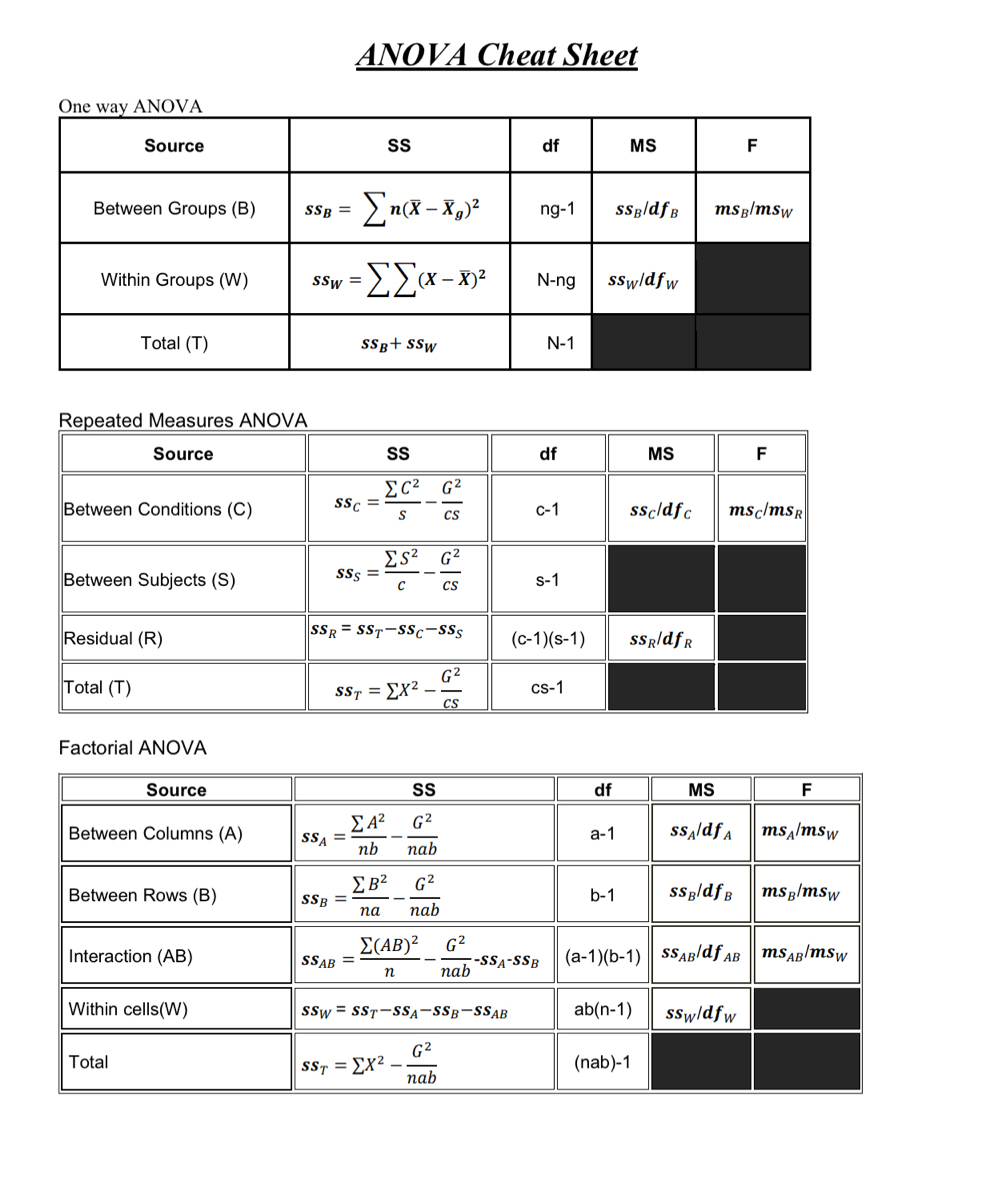

Transcribed Image Text:ANOVA Cheat Sheet
One way ANOVA
Source
df
MS
F
Between Groups (B)
SSB =
ng-1
sSg/dfB
msg/msw
-ΣΣα-
Within Groups (W)
SSw =
N-ng
sSwldfw
Total (T)
SSg+ SSw
N-1
Repeated Measures ANOVA
Source
S
df
MS
F
EC? G?
Ssc =
Between Conditions (C)
с-1
sscldfc
msc/msR
cs
Es? G?
SSs =
Between Subjects (S)
s-1
CS
Residual (R)
SSR = SST-SSc-SSs
(c-1)(s-1)
SSRldfR
G2
Total (T)
SST = EX2 –.
CS
cs-1
Factorial ANOVA
Source
df
MS
F
ΣΑΡ
SS, =
nb
G2
Between Columns (A)
а-1
ss,ldfA
msĄ/msw
nab
G2
EB2
SSB =
па
ss gldfB
Between Rows (B)
b-1
mSg/msw
nab
E(AB)?
G?
ass-Vss-
(a-1)(b-1) | SSAB/df AB | msAB/msw
Interaction (AB)
SSAB =
nab
Within cells(W)
SSw = SST-SSĄ-SSB-SSAB
ab(n-1)
sSwldfw
G2
SS7 = EX²
Total
(nab)-1
nab

Transcribed Image Text:1. A therapy center wanted to test their training method vs three other styles of training. Five individuals
went through three training groups and were measured on their effectiveness with a mock client. Is
there any difference in the effectiveness of the three programs?
Training 1
Training 2
Training 3
19
17
28
12
19
26
19
13
33
ΣΧ?7175
22
16
30
20
15
26
Critical Value= 4.46
Solve for the appropriate test statistic(s). Fill out a completed ANOVA Table on the answer sheet
Expert Solution
This question has been solved!
Explore an expertly crafted, step-by-step solution for a thorough understanding of key concepts.

Step by stepSolved in 2 steps with 1 images

Knowledge Booster

Similar questions
- One-Way ANOVA A researcher wants to know if the time of day that a test is taken affects critical thinking ability. Factor (IV) = Time of Day DV = correct answers on a critical thinking abilities test. MORNING AFTERNOON NIGHT 4 3 8 3 1 4 5 3 6 4 1 6 ENTER VARIABLE: Time_of_Day Value Labels for each level 1 = Morning, 2 = afternoon, 3 = Night Move DV in to “Dependent List” Move IV in to “Factor” Select the Tukey post hoc analysis Click “options” Descriptive Stats Homogeneity of Variance test (should be greater than alpha level) THREE or FOUR THINGS to REPORT You will be reporting three or four things, depending on whether you find a significant results for your one-way ANOVA. Test type and use You want to tell your reader what type of analysis you conducted. This will help your reader make sense of your results. You also want to tell your reader why this particular analysis was used. What did your analysis test for? EXAMPLE: “A…arrow_forwardANOVA: Single Factor SUMMARY Groups Treatment 1 Treatment 2 Treatment 3 Treatment 4 ANOVA Source of Variation Between Groups Within Groups Total Count 16 19 17 15 SS 65.2023 409.9619 475.1642 Sum 87 111 66 53 Average Variance 5.4375 9.0625 5.8421 8.3626 3.8823 4.6103 3.5333 3.5524 df MS A B C F P-value Find the values that would go in boxes A, B, and C of this ANOVA table. Please identify each answer by typing the following below A = # , B = #, C = #arrow_forwardWe have a table of cities and temperatures. Use 1 Way fixed-effects ANOVA tocalculate the F value showing your work.city temperatureOrlando 70Orlando 65Orlando 60Orlando 65Dallas 75Dallas 65Dallas 60Dallas 60Chicago 50Chicago 50Chicago 40Chicago 40The null hypothesis is H0 : µOrlando = µDallas = µChicagoarrow_forward
- Statistical significance at the 0.01 level is more difficult to achieve easier to achieve ○ less costly O less informative than significance at the 0.05 level.arrow_forwardDistrict Assessment of Topic / X K Scruz 00683 - G7M3 Topic A.pdf x b web.kamihq.com/web/viewer.html?state=%7B"ids"%3A%5B"1Fu-ewnjY8-E2hmPAR-e9hoqlfqx4hF4a"%5D%2C"action"%3.. C K E U-46 Links O History random - Soundtrap Imported O homework H Dashboard | Tinker. A Canton Middle Sch. Other bookmarks E Reading list Kami Student Edu O A 7th MATH - St.. SCruz 00683 - G7M3 Topic A.pdf 112% Submit So * Select Montserrat 18px 1.5pt : в I U A A O x, x2 Dictionary Read Aloud 3. Subtract: (4х + 7) — (18х — 2) A Markup 22x - 5 Comment ** T Text Box 18 - ÷ Equation Drawing Shapes Eraser 4. Write the expression below as a product of two factors. 9m + 15n - 6 Add Media Signature Page 1 /3 Sign out INTL 1 10:28arrow_forwardWhat type of data are required for Independent Variable (IV) and Dependent variable (DV) in ANOVA? Group of answer choices DV is continuous and IV is categorical DV is categorical and IV is categorical DV is categorical and IV is continuous DV is continuous and IV is continuous Type of data does not matter for ANOVAarrow_forward
- 6. Interval estimation when o is unknown (the data “Alcohol" is provided) Consumption of alcoholic beverages by young women of drinking age has been increas- ing in the United Kingdom, the United States, and Europe (The Wall Street Journal, Feb- ruary 15, 2006). Data (annual consumption in liters) consistent with the findings reported in The Wall Street Journal article are shown for a sample of 20 European young women. 266 82 199 174 97 170 222 115 130 169 164 102 113 171 93 93 110 130 Assuming the population is roughly symmetric, construct a 95% confidence interval for the mean annual consumption of alcoholic beverages by European young women.arrow_forwardE Buildings- Goog 7 My S I Entrata „tmp_lease_doc Discussion O Mail - Deborah A A southtexascollege.blackboard.com/ultra/courses/_302036_1/outline/discussion/ 10732509_1?view=discussions&coursele E Apps UTRGV | College of.. M What Are Liberal Ar. Discussion Topic Determine whether the data are qualatative or quantative, and determine the level of measurement of the data set. Explain your reasoning. (a) The numbers of employees at fast-food restaurants in a city are listed. 20, 1,1 6, 31, 17, 23, 12. 18, 40, 22 13, 8, 18, 14, 37, 32. 25, 27, 25, 18 (b) The grade point average (GPAS) for a class of students are listed. 3.6, 3.2, 2.0, 3.8, 3.0, 3.5, 1.7, 3.2 2.2, 4.0, 2.5, 1.9, 2,8, 3.6, 2.5, 3.7 Responses (0) Text style AA B IUA· foo A. Quantative Nominal B. I Interval 10 24 4 6. 7. 8.arrow_forwardEvent A 2/8 Event b 4/8 Event c 3/8 Check rightarrow_forward
arrow_back_ios
arrow_forward_ios
Recommended textbooks for you
- MATLAB: An Introduction with ApplicationsStatisticsISBN:9781119256830Author:Amos GilatPublisher:John Wiley & Sons Inc
 Probability and Statistics for Engineering and th...StatisticsISBN:9781305251809Author:Jay L. DevorePublisher:Cengage Learning
 Statistics for The Behavioral Sciences (MindTap C...StatisticsISBN:9781305504912Author:Frederick J Gravetter, Larry B. WallnauPublisher:Cengage Learning
  Elementary Statistics: Picturing the World (7th E...StatisticsISBN:9780134683416Author:Ron Larson, Betsy FarberPublisher:PEARSON
 The Basic Practice of StatisticsStatisticsISBN:9781319042578Author:David S. Moore, William I. Notz, Michael A. FlignerPublisher:W. H. Freeman
 Introduction to the Practice of StatisticsStatisticsISBN:9781319013387Author:David S. Moore, George P. McCabe, Bruce A. CraigPublisher:W. H. Freeman
MATLAB: An Introduction with Applications
Statistics
ISBN:9781119256830
Author:Amos Gilat
Publisher:John Wiley & Sons Inc
Probability and Statistics for Engineering and th...
Statistics
ISBN:9781305251809
Author:Jay L. Devore
Publisher:Cengage Learning
Statistics for The Behavioral Sciences (MindTap C...
Statistics
ISBN:9781305504912
Author:Frederick J Gravetter, Larry B. Wallnau
Publisher:Cengage Learning
Elementary Statistics: Picturing the World (7th E...
Statistics
ISBN:9780134683416
Author:Ron Larson, Betsy Farber
Publisher:PEARSON
The Basic Practice of Statistics
Statistics
ISBN:9781319042578
Author:David S. Moore, William I. Notz, Michael A. Fligner
Publisher:W. H. Freeman
Introduction to the Practice of Statistics
Statistics
ISBN:9781319013387
Author:David S. Moore, George P. McCabe, Bruce A. Craig
Publisher:W. H. Freeman