Computation. Show your solution and put labels in graph. Given the population data set, solve the following: (10points) 18 20 19 21 19 17 15 17 25 22 19 20 16 18 Mean (2points) Range (2points) Variance (5points) Standard Deviation (1point) Construct a frequency distribution table for the data set using the indicated number of classes. In Table include the following: (20points) Political Blog Reading Times Number of classes: 5 Data set: Time (in minutes) spent reading a political blog in a day 7 39 13 9 25 8 22 0 2 18 2 30 7 35 12 15 8 6 5 29 0 11 39 16 15 a. Frequency (2points) b. Class Marks (2 points) c. Relative frequencies (2points) d. Cumulative frequencies (2points) e. Class Boundaries (2points) f. Histogram (2points) g. Bar graph (2points) h. Frequency Polygon (2points) i. Frequency Ogive (2points) j. Mean (grouped data) (2points) Use the following data set. The data represent the fuel economies (in highway miles per gallon) of several Harley-Davidson motorcycles. (10points) 53 57 60 57 54 53 54 53 54 42 48 53 47 47 50 48 42 42 54 54 60 a. Find the five-number summary of the data set. (5points) b. Find the interquartile range (1points) c. Make a box and whisker plot of the data. (2points) d. About how many motorcycles fall on or below the third quartile? (2points)
Computation. Show your solution and put labels in graph. Given the population data set, solve the following: (10points) 18 20 19 21 19 17 15 17 25 22 19 20 16 18 Mean (2points) Range (2points) Variance (5points) Standard Deviation (1point) Construct a frequency distribution table for the data set using the indicated number of classes. In Table include the following: (20points) Political Blog Reading Times Number of classes: 5 Data set: Time (in minutes) spent reading a political blog in a day 7 39 13 9 25 8 22 0 2 18 2 30 7 35 12 15 8 6 5 29 0 11 39 16 15 a. Frequency (2points) b. Class Marks (2 points) c. Relative frequencies (2points) d. Cumulative frequencies (2points) e. Class Boundaries (2points) f. Histogram (2points) g. Bar graph (2points) h. Frequency Polygon (2points) i. Frequency Ogive (2points) j. Mean (grouped data) (2points) Use the following data set. The data represent the fuel economies (in highway miles per gallon) of several Harley-Davidson motorcycles. (10points) 53 57 60 57 54 53 54 53 54 42 48 53 47 47 50 48 42 42 54 54 60 a. Find the five-number summary of the data set. (5points) b. Find the interquartile range (1points) c. Make a box and whisker plot of the data. (2points) d. About how many motorcycles fall on or below the third quartile? (2points)
Oh no! Our experts couldn't answer your question.
Don't worry! We won't leave you hanging. Plus, we're giving you back one question for the inconvenience.
Submit your question and receive a step-by-step explanation from our experts in as fast as 30 minutes.
You have no more questions left.
Message from our expert:
It looks like you may have submitted a graded question that, per our Honor Code, experts cannot answer. We've credited a question to your account.
Your Question:
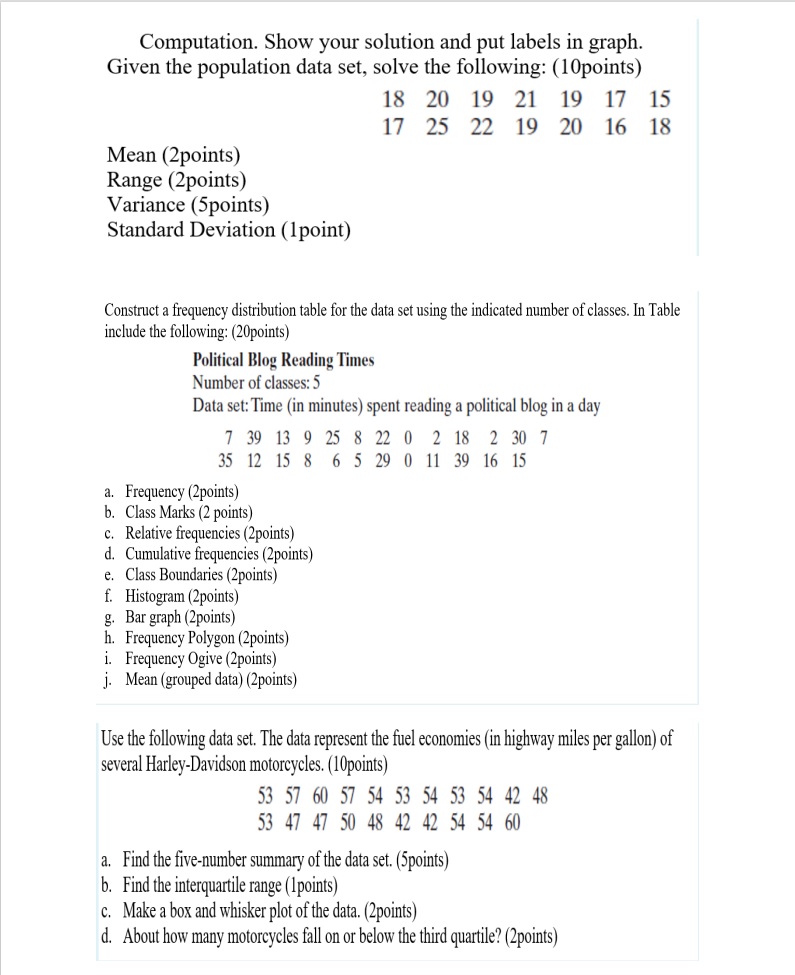
Transcribed Image Text:Computation. Show your solution and put labels in graph.
Given the population data set, solve the following: (10points)
18 20 19 21 19 17 15
17 25 22 19 20 16 18
Mean (2points)
Range (2points)
Variance (5points)
Standard Deviation (1point)
Construct a frequency distribution table for the data set using the indicated number of classes. In Table
include the following: (20points)
Political Blog Reading Times
Number of classes: 5
Data set: Time (in minutes) spent reading a political blog in a day
7 39 13 9 25 8 22 0 2 18 2 30 7
35 12 15 8
6 5
29 0 11 39 16 15
a. Frequency (2points)
b. Class Marks (2 points)
c. Relative frequencies (2points)
d. Cumulative frequencies (2points)
e. Class Boundaries (2points)
f. Histogram (2points)
g. Bar graph (2points)
h. Frequency Polygon (2points)
i. Frequency Ogive (2points)
j. Mean (grouped data) (2points)
Use the following data set. The data represent the fuel economies (in highway miles per gallon) of
several Harley-Davidson motorcycles. (10points)
53 57 60 57 54 53 54 53 54 42 48
53 47 47 50 48 42 42 54 54 60
a. Find the five-number summary of the data set. (5points)
b. Find the interquartile range (1points)
c. Make a box and whisker plot of the data. (2points)
d. About how many motorcycles fall on or below the third quartile? (2points)

Recommended textbooks for you

Glencoe Algebra 1, Student Edition, 9780079039897…
Algebra
ISBN:
9780079039897
Author:
Carter
Publisher:
McGraw Hill

Holt Mcdougal Larson Pre-algebra: Student Edition…
Algebra
ISBN:
9780547587776
Author:
HOLT MCDOUGAL
Publisher:
HOLT MCDOUGAL

Big Ideas Math A Bridge To Success Algebra 1: Stu…
Algebra
ISBN:
9781680331141
Author:
HOUGHTON MIFFLIN HARCOURT
Publisher:
Houghton Mifflin Harcourt
Glencoe Algebra 1, Student Edition, 9780079039897…
Algebra
ISBN:
9780079039897
Author:
Carter
Publisher:
McGraw Hill
Holt Mcdougal Larson Pre-algebra: Student Edition…
Algebra
ISBN:
9780547587776
Author:
HOLT MCDOUGAL
Publisher:
HOLT MCDOUGAL
Big Ideas Math A Bridge To Success Algebra 1: Stu…
Algebra
ISBN:
9781680331141
Author:
HOUGHTON MIFFLIN HARCOURT
Publisher:
Houghton Mifflin Harcourt