MATLAB: An Introduction with Applications
6th Edition
ISBN: 9781119256830
Author: Amos Gilat
Publisher: John Wiley & Sons Inc
expand_more
expand_more
format_list_bulleted
Concept explainers
Question

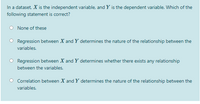
Transcribed Image Text:In a dataset, X is the independent variable, and Y is the dependent variable. Which of the
following statement is correct?
None of these
Regression between X and Y determines the nature of the relationship between the
variables.
Regression between X and Y determines whether there exists any relationship
between the variables.
Correlation between X and Y determines the nature of the relationship between the
variables.
Expert Solution
This question has been solved!
Explore an expertly crafted, step-by-step solution for a thorough understanding of key concepts.
Step by stepSolved in 2 steps

Knowledge Booster
Learn more about
Need a deep-dive on the concept behind this application? Look no further. Learn more about this topic, statistics and related others by exploring similar questions and additional content below.Similar questions
- Find the least squares regression line for the data points. (Let x be the independent variable and y be the dependent variable.) (-1, 2), (1, 0), (3, –1) y = -0.75x +1.0833arrow_forwardStatisticsarrow_forwardThe Simple Linear Regression model is Y = b0 + b1*X1 + u and the Multiple Linear Regression model with k variables is: Y = b0 + b1*X1 + b2*X2 + ... + bk*Xk + u Y is the dependent variable, the X1, X2, ..., Xk are the explanatory variables, b0 is the intercept, b1, b2, ..., bk are the slope coefficients, and u is the error term, Yhat represents the OLS fitted values, uhat represent the OLS residuals, b0_hat represents the OLS estimated intercept, and b1_hat, b2_hat,..., bk_hat, represent the OLS estimated slope coefficients. QUESTION 4 Suppose we have an SLR model, where the dependent variable (Y) represents ‘how satisfied someone is with his/her life, from 0 to 100’ (the higher the value, the higher the satisfaction with life), and the explanatory variable (X1) represents ‘personal annual income in £1,000’. The estimated OLS regression line is: Yhat = 33.2 + 0.74*X1. According to this model, what is the predicted life satisfaction, for someone with…arrow_forward
- What kind of variable is x in terms of linear regression? * a) Independent b) Dependent c) Both of the above d) None of the abovearrow_forwardConsider the regression model Y₁ = BX; +u; Y Where ui and X; satisfy the assumptions specified here. Let ẞ denote an estimator of ẞ that is constructed as ẞ = Show that ẞ is a linear function of Y₁, Y2,..., Yn. Show that ẞ is conditionally unbiased. 1. E (YiX1, X2,..., Xn) = == X + +Yn) 2. E(B|×1, X2,..., Xn) = E = B Χ | (X1, X2,..., Xn) = where Y and X are the sample means of Y; and X;, respectively.arrow_forwardFind the least squares regression line for temperature (x) and number of ice cream cones sold per hour (y). 65 70 75 80 85 90 95 100 105 y 8 10 11 13 12 16 19 22 23 Oŷ = 2.469x+48.240 ý = 0.383x-17.694 Oŷ = -125.376x+31.656 Oŷ = 0.4x-18arrow_forward
- Linear regression activity. Tune current between one and six years old were randomly selected from the classified ads of the Arizona republic.The following data were obtained where X donates age in years,and y donates price,in hundreds of dollars. x (age) 6,6,6,2,2,5,4,5,1,4 price(100ths) 270,260,275,405,364,295,335,308,405,305 Draw a scatter diagram. Find the linear correlation coefficientr. describe the shape strength and direction.does a linear relationship exist between the age of Corvette and its price (use the critical value to explain).If appropriate explain the slope in contexts. If appropriate explain the Y intercept in context.Predict the price of a one year old Corvette.Find the residual of a one year old Corvette.arrow_forward5arrow_forwardA6 Assume that least squares regression is used to fit a regression line y = â + 3x to data (xi, yi) for i=1,2,..., n. The sample means of the x, and yi are and y, respectively. The variability of the y, about the regression line equals 2. Which of the following expressions would be a suitable estimate for o²? A: 1 n-1 n i=1 (Yi - y)² D: 1 n - 2 B: 0² Σ=1(x − x)2 n Σ(y - a - βα;)2 i=1 0² narrow_forward
arrow_back_ios
SEE MORE QUESTIONS
arrow_forward_ios
Recommended textbooks for you
 MATLAB: An Introduction with ApplicationsStatisticsISBN:9781119256830Author:Amos GilatPublisher:John Wiley & Sons Inc
 Probability and Statistics for Engineering and th...StatisticsISBN:9781305251809Author:Jay L. DevorePublisher:Cengage Learning
 Statistics for The Behavioral Sciences (MindTap C...StatisticsISBN:9781305504912Author:Frederick J Gravetter, Larry B. WallnauPublisher:Cengage Learning
 Elementary Statistics: Picturing the World (7th E...StatisticsISBN:9780134683416Author:Ron Larson, Betsy FarberPublisher:PEARSON
 The Basic Practice of StatisticsStatisticsISBN:9781319042578Author:David S. Moore, William I. Notz, Michael A. FlignerPublisher:W. H. Freeman
 Introduction to the Practice of StatisticsStatisticsISBN:9781319013387Author:David S. Moore, George P. McCabe, Bruce A. CraigPublisher:W. H. Freeman

MATLAB: An Introduction with Applications
Statistics
ISBN:9781119256830
Author:Amos Gilat
Publisher:John Wiley & Sons Inc

Probability and Statistics for Engineering and th...
Statistics
ISBN:9781305251809
Author:Jay L. Devore
Publisher:Cengage Learning

Statistics for The Behavioral Sciences (MindTap C...
Statistics
ISBN:9781305504912
Author:Frederick J Gravetter, Larry B. Wallnau
Publisher:Cengage Learning

Elementary Statistics: Picturing the World (7th E...
Statistics
ISBN:9780134683416
Author:Ron Larson, Betsy Farber
Publisher:PEARSON

The Basic Practice of Statistics
Statistics
ISBN:9781319042578
Author:David S. Moore, William I. Notz, Michael A. Fligner
Publisher:W. H. Freeman

Introduction to the Practice of Statistics
Statistics
ISBN:9781319013387
Author:David S. Moore, George P. McCabe, Bruce A. Craig
Publisher:W. H. Freeman