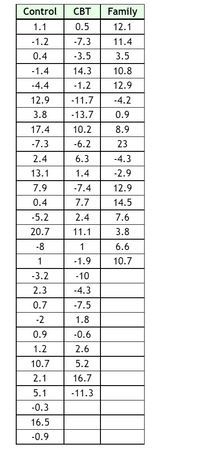
1. State the null and alternative hypotheses.
2.Compute the test statistic. Document how SSTr and SSE were computed. Use 4 decimal places for the sample means, sample standard deviations and the grand mean and round your answers for SSTr and SSE to 2 decimal places.
Use the values for SSTr and SSE to complete the following ANOVA table. Round each of your answers to 2 decimal places. (image of table)
3.Compute the p-value. Provide the name of the distribution and the parameters used to compute the p-value. Then enter your answer rounded to 4 decimal places.
4.Interpret the results of the significance test. Is this result statistically significant? Is this result important from a practical perspective?


Trending nowThis is a popular solution!
Step by stepSolved in 6 steps with 2 images

 Big Ideas Math A Bridge To Success Algebra 1: Stu...AlgebraISBN:9781680331141Author:HOUGHTON MIFFLIN HARCOURTPublisher:Houghton Mifflin Harcourt
 Holt Mcdougal Larson Pre-algebra: Student Edition...AlgebraISBN:9780547587776Author:HOLT MCDOUGALPublisher:HOLT MCDOUGAL
 Glencoe Algebra 1, Student Edition, 9780079039897...AlgebraISBN:9780079039897Author:CarterPublisher:McGraw Hill


