
MATLAB: An Introduction with Applications
6th Edition
ISBN: 9781119256830
Author: Amos Gilat
Publisher: John Wiley & Sons Inc
expand_more
expand_more
format_list_bulleted
Related questions
Question
As apart of a study into healthy lifestyles, Marry recorded a person's position in the university and how frequently they ate a salad. The results are shown in the table Jean conducted a x^2 test for independence at a 5% significance level.
State the hypothesis and state, giving a reason, whether the null hypothesis should be accepted or rejected and in context of the problem.
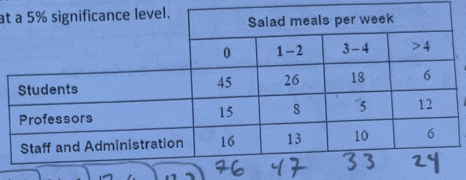

Transcribed Image Text:at a 5% significance level.
Students
Professors
Staff and Administration
Salad meals per week
3-4
18
5
10
33
1-2
26
0
45
15
S
16
13
76 47
>4
6
12
6
24
Expert Solution
This question has been solved!
Explore an expertly crafted, step-by-step solution for a thorough understanding of key concepts.

This is a popular solution

Trending nowThis is a popular solution!

Step by stepSolved in 3 steps with 1 images

Knowledge Booster

Similar questions
- In a certain microwave oven on the high power setting. the time it takes a randomly chosen kernel of popcorn to pop is normally distributed with a mean of 140 seconds and a standard deviation of 25 seconds. What percentage of the kemels will fail to pop if the popcom is cooked for (a) 2 minutes? (b) Three minutes? (c) If you wanted 95 percent of the kernels to pop, what time would you allow? (d) If you wanted 99 percent to pop?arrow_forwardA political scientist claims that 38% of first-year college students characterize themselves as being “moderate” or “middle of the road” as far as their political affiliation is concerned. Believing this claimed value is too high, you survey a random sample of 400 first-year college students and find that 120 characterize themselves as being “moderate” or “middle of the road.” Based on this information, what will the test statistic be? Choose the answer below that is closest to what you calculate, and try not to do a lot of rounding until you get to the very end of your calculations. 1. -0.3 2. -1.2 3. -2.6 4. -3.3 5. None of the other answer options are correct because the test statistic should be positive, not negative.arrow_forwardTo help with its next advertising campaign, a large sporting goods company would like to know which activity fans prefer, watching professional sports games (P) or watching college sports games (C). The accompanying data show the preferences of a random sample of sports fans Using a 0.10, perform a hypothesis test to determine if fans prefer one type of sports over the other. Click the icon to view the data table Let Fp be the proportion of sports fans who prefer watching professional sports games and Fe be the proportion of sports fans who prefer watching college sports games Identify the hypotheses. OB A. HjFpFc H₂ Fp #Fc OC H₂ Fp #Fc H₂ Fp Fc Determine the test statistie The test statistic is (Type an integer or a decimal rounded to two decimal places as needed) example Get more help. MFps Fe H₂ F₂Fc OD H₂ Fp2 Fc Data table Fan 1 2 Preference P P 3 4 6 6 7 8 9 10 No preference 11 P P P C 15 16 P P P 12 13 No preference 14 P C C X werarrow_forward
- A study of seat belt users and nonusers yielded the randomly selected sample data summarized in the accompanying table. Use a 0.05 significance level to test the claim that the amount of smoking is independent of seat belt use. A plausible theory is that people who smoke are less concerned about their health and safety and are therefore less inclined to wear seat belts, Is this theory supported by the sample data? BB Click the icon to view the data table. Determine the null and alternative hypotheses. O A. Ho: The amount of smoking is dependent upon seat belt use. H₁: The amount of smoking is not dependent upon seat belt use. O B. Ho: Heavy smokers are not less likely than non-smokers to wear a seat belt. H₁: Heavy smokers are less likely than non-smokers to wear a seat belt. OC, Ho: Heavy smokers are less likely than non-smokers to wear a seat belt. H₁: Heavy smokers are not less likely than non-smokers to wear a seat belt. O D. Ho: The amount of smoking is independent of seat belt…arrow_forwardDoes reading the Harry Potter books encourage tolerance? It depends. Italian fifth graders were (randomly) split into two groups. Half the students met with researchers and discussed passages from the Harry Potter books that handled prejudice, while the others talked about unrelated sections. *Data are fabricated but match actual results When determining whether or not the main effects and interactions were significant, for the sake of this assignment, let’s say that the difference between the calculated means/differences must be .7 or higher to be significant. Posttest attitudes toward immigration (7-pt scale) Discussed prejudice-related sections Discussed unrelated sections High identification w/ Harry 6.2 5.0 Low identification w/ Harry 4.2 4.4 Is there a main effect of identification? (calculate marginal means). Is there a main effect of section? (calculate marginal means). Is there an interaction effect? (calculate “difference of differences”)…arrow_forwardExplain the difference between a one-tailed and two-tailed significance test. When is it appropriate to use each test?arrow_forward
- I need help finding the test statistic, p-value, and whether or not to reject the null hypothesis. Please explain each step as well as you can. Thank you very much!arrow_forwardDescribe a study in which you can use both nonparametric and parametric statistics. A researcher has participants expecting to receive either painful or mild electrical shocks during a study wait in a quarter-full waiting room with other participants. He then measures whether they choose to sit next to other participants or if they sit far away on their own. What is the best test to run for this study and why?arrow_forwardOI al College is less likely to attend orientation than men before they begin their coursework. A random sample of freshmen at Oxnard College were asked what their gender is and whether they attended orientation. The results of the survey are shown below: Data for Gender vs. Orientation Attendance Select an answer Women Men 439 242 What can be concluded at the a = 0.01 level of significance? For this study, we should use Select an answer a. The null and alternative hypotheses would be: Yes 350 No 262 Ho: Select an answer ✓ Select an answer ✓ Select an answer ✓ (please enter a decimal and note that p1 and μl represent the proportion and mean for women and p2 and μ2 represent the proportion and mean for men.) H₁: b. The test statistic ? | = c. The p-value d. The p-value is ? ✓ a e. Based on this, we should f. Thus, the final conclusion is that ... Select an answer ✓ Select an answer (Please enter a decimal) (please show your answer to 3 decimal places.) (Please show your answer to 4…arrow_forward
- The personality characteristics of business leaders (e.g., CEOS) are related to the operations of the businesses that they lead (Oreg & Berson, 2018). Traits like openness to experience are related to positive financial outcomes and other traits are related to negative financial outcomes for their businesses. Suppose that a board of directors is interested in evaluating the personality of their leadership. Among a sample of n = 16 managers, the sample mean of the openness to experiences dimension of personality was M = 4.50. Assuming that u = 4.24 and o = 1.05 (Cobb-Clark & Schurer, 2012), use a two-tailed hypothesis test with a = .05 to test the hypothesis that this company's business leaders' openness to experience is different from the population. Standard Normal Distribution Mean - 0.0 Standard Deviation 1.0 .7198 .1401 .1401 -3.0 -2.0 -1.0 0.0 1.0 2.0 3.0 -1.08 1.08 Step 1. Ho: ; H;: a = .05. Step 2. The critical region consists of Step 3. For these data the standard error is and…arrow_forwardA dowser has correctly located water for a well 1 out of 2 times in Jones County. In Jones County, someone who is just guessing has a 40% chance of locating water for a well. Does this sample provide sufficient evidence that the dowser can locate water and is not just guessing?arrow_forwarduse the math problem uploaded to answer the question. Will you reject or fail to reject the null hypothesis? choose one: a) The P-Value is greater than the level of significance and so we reject the null hypothesis that the variances are equal. At 0.05 level of significance, we conclude that the variance for the first plot is greater than the variance for the second plot. b) The P-Value is greater than the level of significance and so we fail to reject the null hypothesis that the variances are equal. At 0.05 level of significance, we conclude that the variance for the first plot is equal to the variance for the second plot. c) The P-Value is greater than the level of significance and so we reject the null hypothesis that the variances are equal. At 0.05 level of significance, we conclude that the variance for the first plot is equal to the variance for the second plot. d) The P-Value is less than the level of significance and so we fail to reject the null hypothesis…arrow_forward
arrow_back_ios
arrow_forward_ios
Recommended textbooks for you
- MATLAB: An Introduction with ApplicationsStatisticsISBN:9781119256830Author:Amos GilatPublisher:John Wiley & Sons Inc
 Probability and Statistics for Engineering and th...StatisticsISBN:9781305251809Author:Jay L. DevorePublisher:Cengage Learning
 Statistics for The Behavioral Sciences (MindTap C...StatisticsISBN:9781305504912Author:Frederick J Gravetter, Larry B. WallnauPublisher:Cengage Learning
  Elementary Statistics: Picturing the World (7th E...StatisticsISBN:9780134683416Author:Ron Larson, Betsy FarberPublisher:PEARSON
 The Basic Practice of StatisticsStatisticsISBN:9781319042578Author:David S. Moore, William I. Notz, Michael A. FlignerPublisher:W. H. Freeman
 Introduction to the Practice of StatisticsStatisticsISBN:9781319013387Author:David S. Moore, George P. McCabe, Bruce A. CraigPublisher:W. H. Freeman
MATLAB: An Introduction with Applications
Statistics
ISBN:9781119256830
Author:Amos Gilat
Publisher:John Wiley & Sons Inc
Probability and Statistics for Engineering and th...
Statistics
ISBN:9781305251809
Author:Jay L. Devore
Publisher:Cengage Learning
Statistics for The Behavioral Sciences (MindTap C...
Statistics
ISBN:9781305504912
Author:Frederick J Gravetter, Larry B. Wallnau
Publisher:Cengage Learning
Elementary Statistics: Picturing the World (7th E...
Statistics
ISBN:9780134683416
Author:Ron Larson, Betsy Farber
Publisher:PEARSON
The Basic Practice of Statistics
Statistics
ISBN:9781319042578
Author:David S. Moore, William I. Notz, Michael A. Fligner
Publisher:W. H. Freeman
Introduction to the Practice of Statistics
Statistics
ISBN:9781319013387
Author:David S. Moore, George P. McCabe, Bruce A. Craig
Publisher:W. H. Freeman