
ENGR.ECONOMIC ANALYSIS
14th Edition
ISBN: 9780190931919
Author: NEWNAN
Publisher: Oxford University Press
expand_more
expand_more
format_list_bulleted
Related questions
Question
State at least one type of conclusion that could be made from the data provided for the KPI. Suggest one other data source that would provide more information to make data-driven decisions. Explain what information that source would supply.
(The blue one is mine) or pretty much what can be said of the line graph
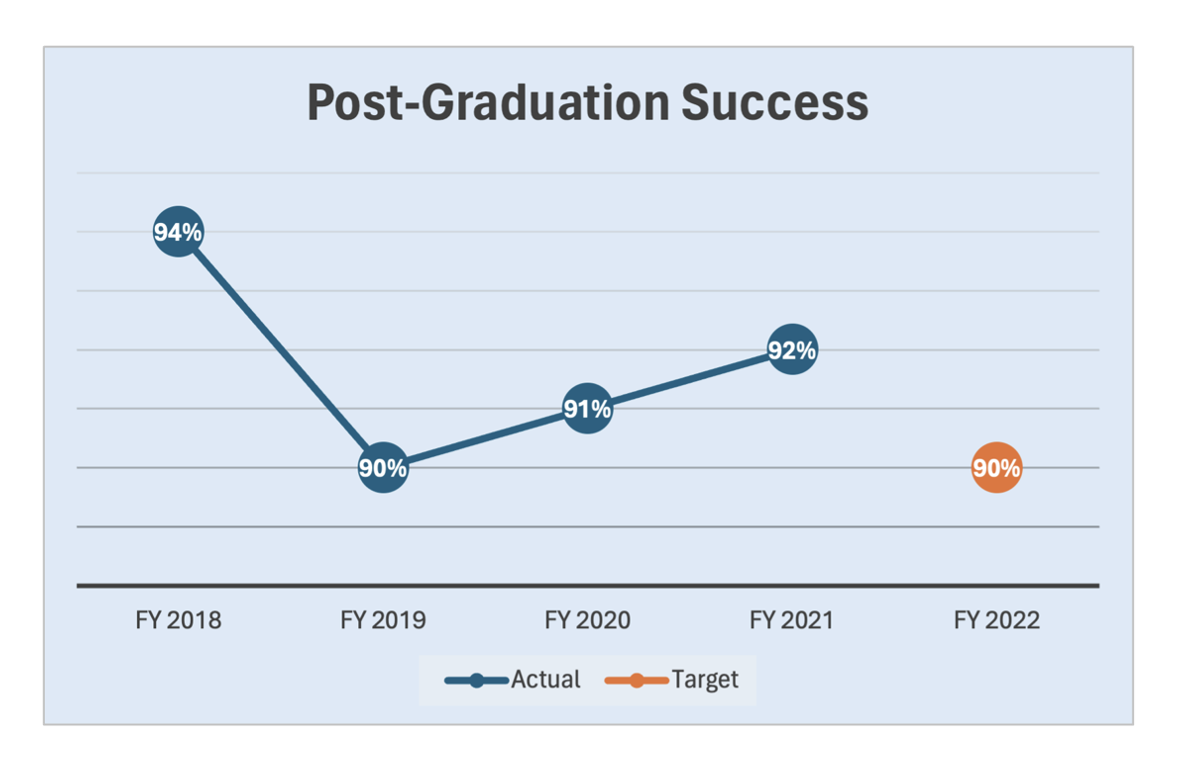

Transcribed Image Text:94%
FY 2018
Post-Graduation Success
90%
FY 2019
91%
FY 2020
Actual
Target
92%
FY 2021
90%
FY 2022
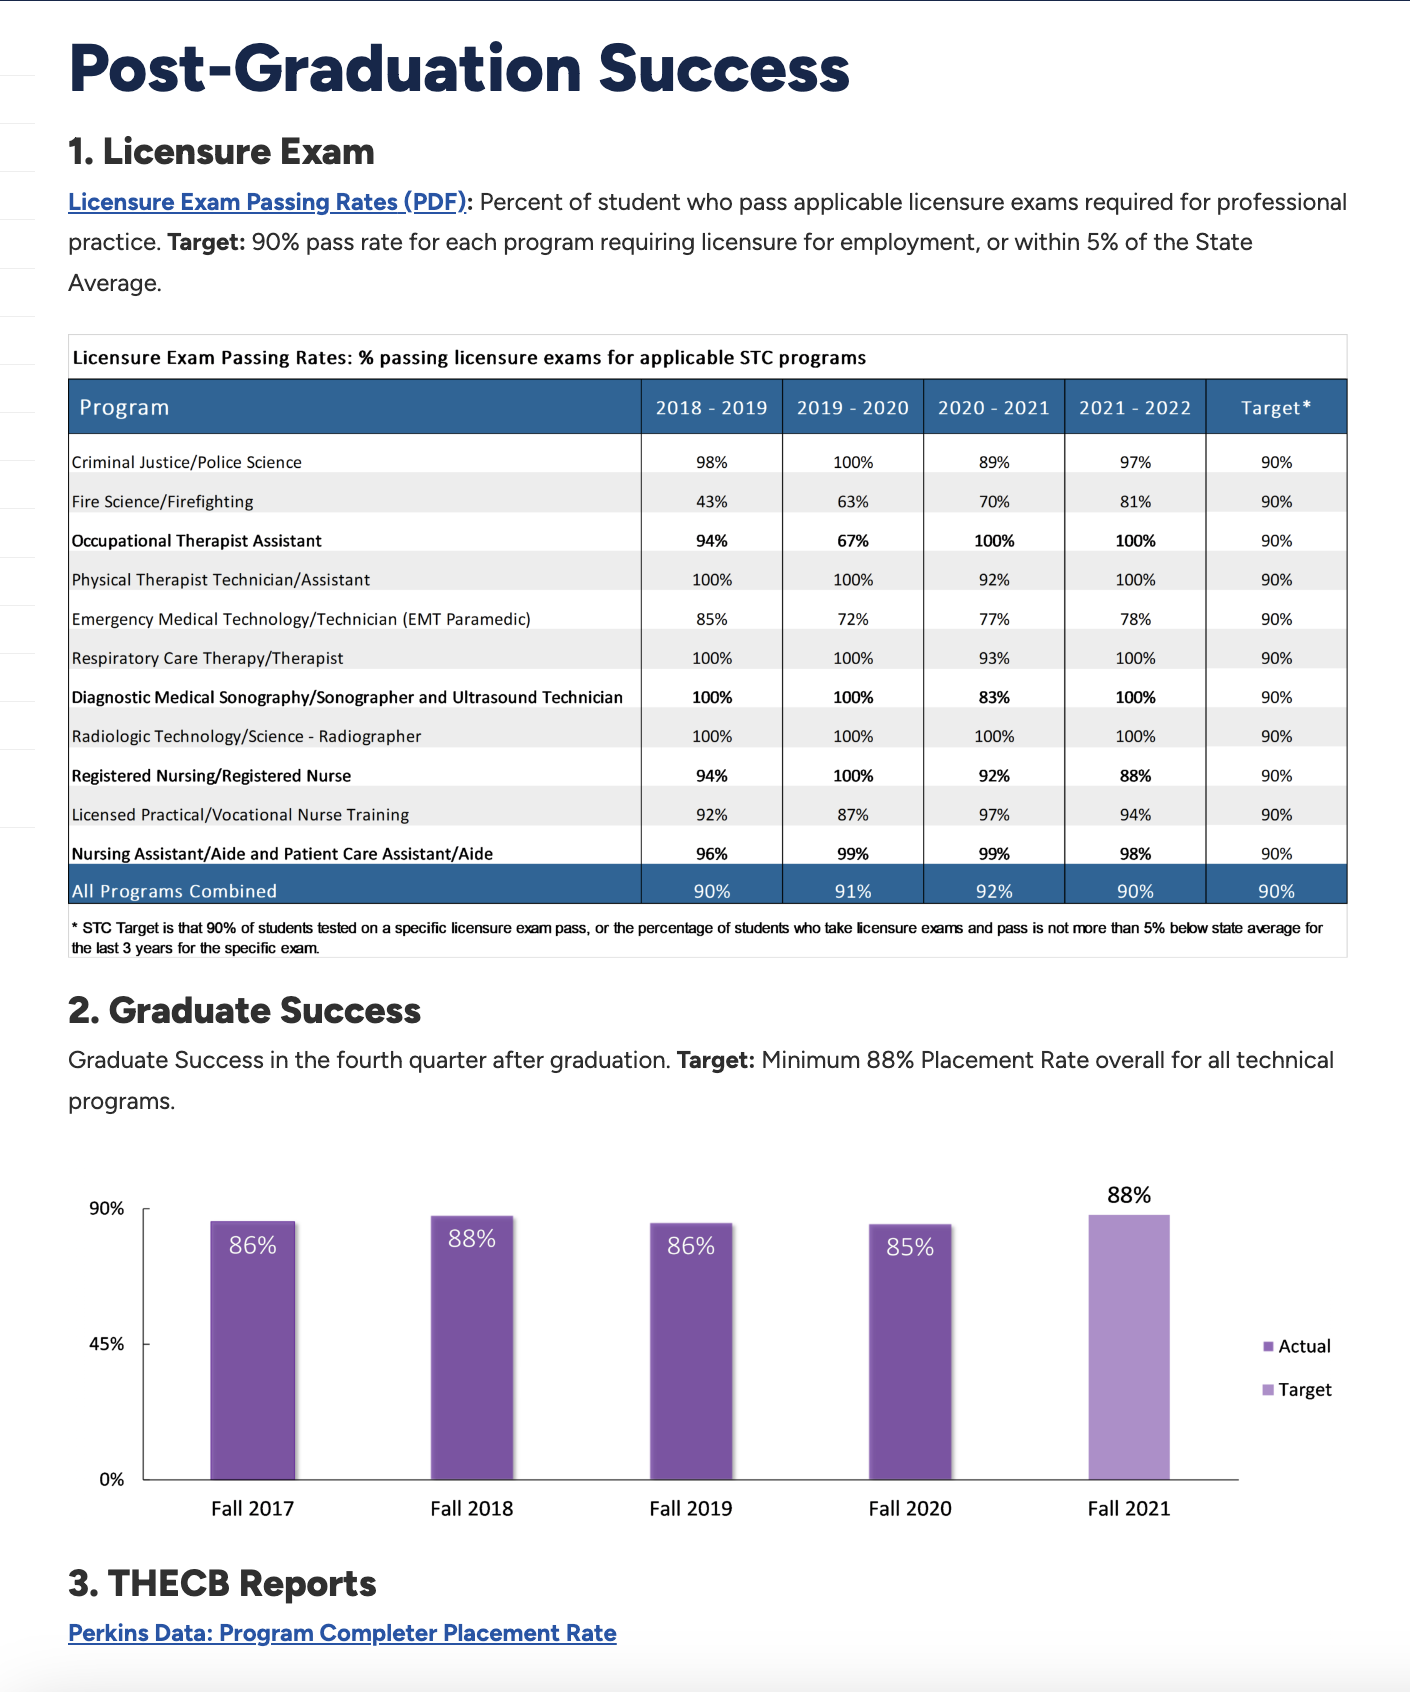
Transcribed Image Text:Post-Graduation Success
1. Licensure Exam
Licensure Exam Passing Rates (PDF): Percent of student who pass applicable licensure exams required for professional
practice. Target: 90% pass rate for each program requiring licensure for employment, or within 5% of the State
Average.
Licensure Exam Passing Rates: % passing licensure exams for applicable STC programs
Program
Criminal Justice/Police Science
Fire Science/Firefighting
90%
45%
0%
86%
Fall 2017
88%
2018-2019
Fall 2018
98%
3. THECB Reports
Perkins Data: Program Completer Placement Rate
43%
94%
100%
Occupational Therapist Assistant
Physical Therapist Technician/Assistant
Emergency Medical Technology/Technician (EMT Paramedic)
Respiratory Care Therapy/Therapist
Diagnostic Medical Sonography/Sonographer and Ultrasound Technician
Radiologic Technology/Science - Radiographer
Registered Nursing/Registered Nurse
Licensed Practical/Vocational Nurse Training
Nursing Assistant/Aide and Patient Care Assistant/Aide
All Programs Combined
90%
* STC Target is that 90% of students tested on a specific licensure exam pass, or the percentage of students who take licensure exams and pass is not more than 5% below state average for
the last 3 years for the specific exam.
85%
100%
100%
100%
94%
92%
96%
90%
2019-2020
86%
00%
Fall 2019
63%
67%
100%
72%
100%
100%
100%
100%
87%
99%
91%
2020-2021 2021 2022
85%
89%
70%
Fall 2020
100%
92%
77%
93%
83%
100%
92%
97%
99%
97%
92%
81%
100%
100%
78%
100%
100%
100%
88%
94%
98%
90%
2. Graduate Success
Graduate Success in the fourth quarter after graduation. Target: Minimum 88% Placement Rate overall for all technical
programs.
Target*
88%
90%
Fall 2021
90%
90%
90%
90%
90%
90%
90%
90%
90%
90%
■ Actual
Target
Expert Solution
This question has been solved!
Explore an expertly crafted, step-by-step solution for a thorough understanding of key concepts.

Step by stepSolved in 3 steps

Knowledge Booster


Learn more about
Need a deep-dive on the concept behind this application? Look no further. Learn more about this topic, economics and related others by exploring similar questions and additional content below.Similar questions
- Course: Introduction to Microeconomics1. Our students Francisca and Javier have a heated discussion about Axioms of Preference and Rational Consumer Choice, from which they raise questions and reflections regarding topics seen in class. You are asked to comment on each of these statements, justifying whether statement is true, false or uncertain. You should be supported by graphic analysis as appropriate.Statements that our students arrive at are as follows:(a) To have consistent ordering and represent convex indifference curves, only Axioms of order (Monotonicity) and Transitivity are needed.b) For a consumer to find equally preferred baskets from an initial basket, he must establish a substitution relationship between goods to stay on same indifference curve.c) Given consumer's income, the best he can do with respect to his consumption decision, is to find a situation where marginal utility per weight spent on good X is equal to marginal utility per weight spent on good Y.arrow_forwardCindy Jo's Hair Salon is concerned about its rising costs of supplies, energy, and labor, so it is considering investing in better equipment, which hopefully will reduce the time required to perform most hairstyles as well as result in better perceived quality by its customers. It predicts that the added investment will increase output levels as well as reduce energy costs, since some of the new equipment (hair dryers) use less electricity. Labor Energy Material Total Hide Feedback investment Using the given information, determine the current and expected single-factor and total productivity measures. Do not round intermediate calculations. Round your answers to three decimal places. Productivity Current (this year) haircuts/dollar Ⓡ Incorrect haircuts/dollar Ⓡ haircuts/dollar .28 € haircuts/dollar Expected (next year) Ⓡ haircuts/dollar haircuts/dollar Ⓡ Inputs and Current (this Expected (next Outputs year) year) Hairstyles per 280 320 Labor costs per $970 $1,020 M Energy costs per…arrow_forwardYou produce shoes (Q) with labor (L) and capital (K). The production process is as so: Q = 400L - 20L2 + 600K – 10K2 The cost of labor is $20 and the cost of capital is $30. You have a budget of $550. How many units of capital(K) should you rent/buy? Enter as a value.arrow_forward
- help please answer in text form with proper workings and explanation for each and every part and steps with concept and introduction no AI no copy paste remember answer must be in proper format with all workingarrow_forwardC. Suppose your neighbor is a physics major who also races motorcycles, and she tells you that horsepower can be expressed in terms of the following equation: H = MDA/S where M=mass, D-distance, A=acceleration and S and H are as defined above. Based on this conversation with your neighbor, you decide to change the functional form of the relationship to include 1/H rather than H as an explanatory variable because that's the appropriate theoretical relationship between the two variables. Estimate the above equation, substituting 1/H for H. Which of the two models do you prefer and why?arrow_forwardhelp please answer in text form with proper workings and explanation for each and every part and steps with concept and introduction no AI no copy paste remember answer must be in proper format with all workingarrow_forward
- MICROECONOMICS Questions 3 ( ALL OF IT IS ONE QUESTION!!!) For article 3 write the number of the graph that best describes what happened. Fill in only the appropriate boxes in the chart for article 3 and be sure and indicate if it is an increase or a decrease. For the graph use an arrow to indicate an increase or a decrease. Make sure you fill in the graph PLEASE Leave it blank if there is no change Masks (Now). The easing Covid-19 pandemic is expected to reduce demand for medical masks this year, joining a group of companies that have forecast a decline in business from Covid-19 prevention. Masks became a billion-dollar business for the St. Paul, Minn., manufacturer starting in 2020, when the virus’s rapid spread sent consumers and healthcare workers looking to secure facial coverings to try to avoid infection. Now, as the latest U.S. surge caused by the Omicron variant fades, 3M said they are seeing slowing mask sales. WHICH GRAPH BEST FITS THE ARTICLE. Graph # Graph…arrow_forwardPlease give me correct answer with full explanation and calculation otherwise i give multiple downvote Note:- Please avoid using ChatGPT and refrain from providing handwritten solutions; otherwise, I will definitely give a downvote. Also, be mindful of plagiarism. Answer completely and accurate answer. Rest assured, you will receive an upvote if the answer is accurate.arrow_forward
arrow_back_ios
arrow_forward_ios
Recommended textbooks for you
 Principles of Economics (12th Edition)EconomicsISBN:9780134078779Author:Karl E. Case, Ray C. Fair, Sharon E. OsterPublisher:PEARSON
 Engineering Economy (17th Edition)EconomicsISBN:9780134870069Author:William G. Sullivan, Elin M. Wicks, C. Patrick KoellingPublisher:PEARSON
 Principles of Economics (MindTap Course List)EconomicsISBN:9781305585126Author:N. Gregory MankiwPublisher:Cengage Learning
 Managerial Economics: A Problem Solving ApproachEconomicsISBN:9781337106665Author:Luke M. Froeb, Brian T. McCann, Michael R. Ward, Mike ShorPublisher:Cengage Learning
 Managerial Economics & Business Strategy (Mcgraw-...EconomicsISBN:9781259290619Author:Michael Baye, Jeff PrincePublisher:McGraw-Hill Education
Principles of Economics (12th Edition)
Economics
ISBN:9780134078779
Author:Karl E. Case, Ray C. Fair, Sharon E. Oster
Publisher:PEARSON
Engineering Economy (17th Edition)
Economics
ISBN:9780134870069
Author:William G. Sullivan, Elin M. Wicks, C. Patrick Koelling
Publisher:PEARSON
Principles of Economics (MindTap Course List)
Economics
ISBN:9781305585126
Author:N. Gregory Mankiw
Publisher:Cengage Learning
Managerial Economics: A Problem Solving Approach
Economics
ISBN:9781337106665
Author:Luke M. Froeb, Brian T. McCann, Michael R. Ward, Mike Shor
Publisher:Cengage Learning
Managerial Economics & Business Strategy (Mcgraw-...
Economics
ISBN:9781259290619
Author:Michael Baye, Jeff Prince
Publisher:McGraw-Hill Education