
MATLAB: An Introduction with Applications
6th Edition
ISBN: 9781119256830
Author: Amos Gilat
Publisher: John Wiley & Sons Inc
expand_more
expand_more
format_list_bulleted
Related questions
Question
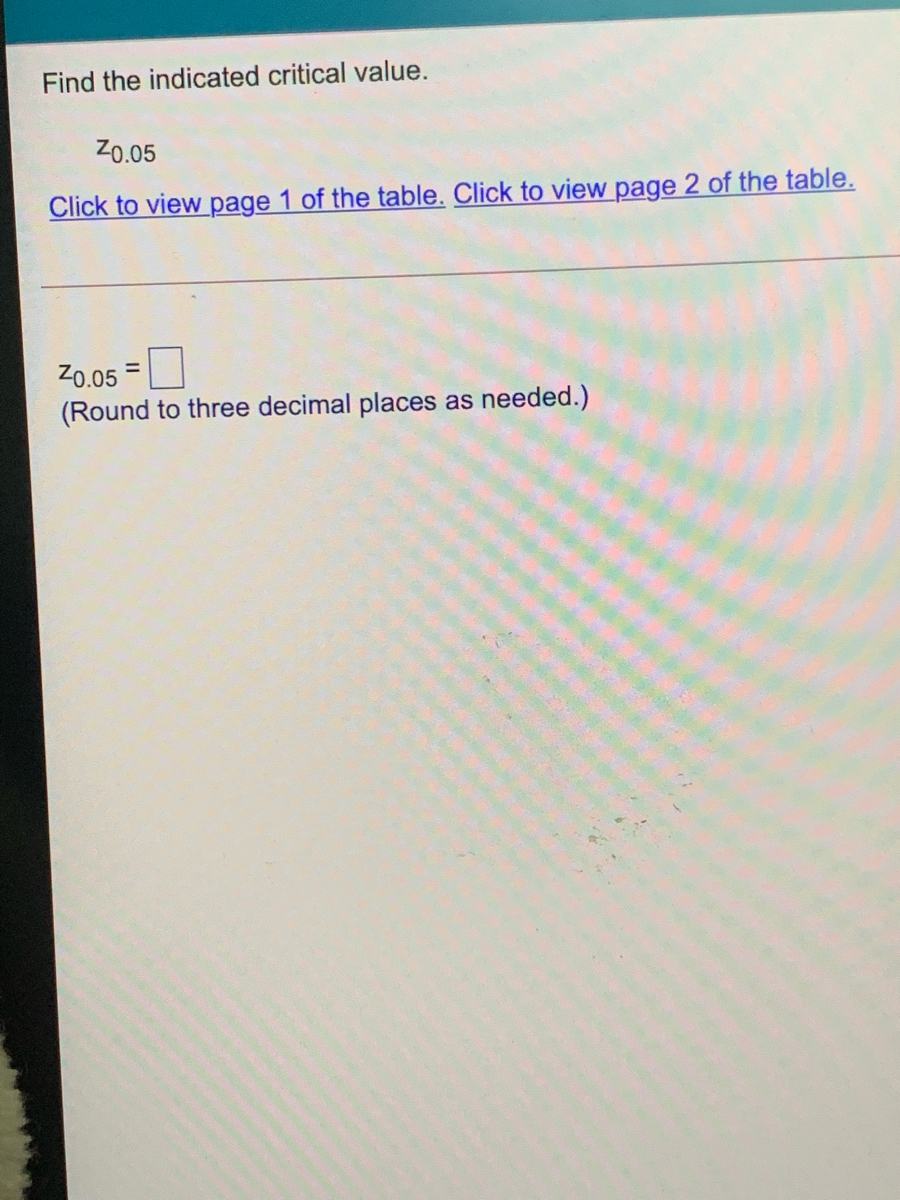

Transcribed Image Text:Find the indicated critical value.
Z0.05
Click to view page 1 of the table. Click to view page 2 of the table.
Z0.05 =
(Round to three decimal places as needed.)

Transcribed Image Text:Standard normal table (page 2)
POSITIVE z Scores
Standard Normal (z) Distribution: Cumulative Area from the LEFT
.00
01
.02
.03
.04
.05
.06
.07
.08
.09
0.0
.5000
5040
5080
5120
5160
5199
.5239
5279
.5319
.5359
0.1
.5398
5438
5478
5517
5557
.5596
.5636
,5675
5714
5753
0.2
5793
5832
5871
5910
5948
5987
6026
6064
.6103
.6141
0.3
.6179
6217
6255
6293
.6331
6368
6406
.6443
6480
,6517
0.4
.6554
6591
6628
.6664
.6700
.6736
.6772
.6808
6844
.6879
0.5
.6915
6950
6985
7019
7054
7088
.7123
7157
7190
.7224
0.6
.7257
7291
7324
7357
7389
7422
7454
.7486
7517
.7549
0,7
7580
761
7642
7673
.7704
.7734
7764
7794
.7823
.7852
0.8
.7881
7910
7939
.7967
7995
8023
.8051
8078
.8106
8133
.8315
.8554
0.9
8159
8186
8212
8238
8264
.8289
8340
.8365
.8389
1.0
8413
8438
8461
8485
8508
8531
.8577
.8599
.8621
1.1
8643
8665
8686
.8708
8729
8749
.8770
.8790
8810
.8830
1.2
8849
8869
8888
8907
8925
8944
8962
.8980
.8997
9015
1,3
9032
9049
.9066
.9082
9099
.9115
.9131
.9147
9162
.9177
1,4
9192
9207
9222
9236
.9251
9265
9279
9292
9306
9319
1.5
9332
9345
9357
.9370
.9382
.9394
.9406
.9418
9429
.9441
1.6
9452
9463
9474
9484
9495
9505
9515
9525
.9535
9545
1.7
9554
.9564
9573
.9582
.9591 A 9599
.9608
.9616
.9625
.9633
1.8
9641
9649
.9656
9664
.9671
.9678
.9686
9693
.9699
.9706
1.9
9713
9719
.9726
.9732
.9738
.9744
.9750
.9756
.9761
.9767
2.0
9772
9778
9783
.9788
.9793
.9798
.9803
.9808
.9812
9817
Print
Done
Expert Solution
This question has been solved!
Explore an expertly crafted, step-by-step solution for a thorough understanding of key concepts.

Step by stepSolved in 2 steps with 2 images

Knowledge Booster

Similar questions
- Find the area of the shaded region under the standard normal curve. Standard normal table E Click here to view the standard normal table. .00 .01 .02 .03 .04 .05 .06 .07 .08 .09 0.0 .5000 5040 .5080 .5120 .5160 5199 .5239 .5279 .5319 .5359 0.0 0,1 .5557 .5948 .5636 .6026 0.1 .5398 .5438 5478 .5517 .5596 .5675 .5714 .5753 z = 0.62 5793 .6179 0.2 .5832 5871 .5910 .5987 .6064 .6103 .6141 0.2 .6443 .6808 0.3 .6217 .6255 .6293 .6331 .6368 .6406 .6480 .6517 0.3 0.4 6700 .6554 .6591 .6628 .6664 .6736 .6772 .6844 .6879 0.4 The area of the shaded region is 7123 0.5 6915 6950 6985 7019 7054 .7088 .7157 7190 .7224 0.5 (Round to four decimal places as needed.) 7454 .7486 06 .7257 7291 7324 .7357 .7389 .7422 7517 7549 0.6 0.7 7580 7611 .7642 .7673 7704 .7734 .7764 7794 7823 7852 0.7 7910 8078 0.8 .7881 .7939 .7967 7995 .8023 .8051 .8106 .8133 0.8 .8264 .8340 0.9 0.9 .8159 .8186 .8212 .8238 .8289 .8315 .8365 .8389 1.0 .8413 .8438 .8461 .8485 .8508 .8531 .8554 .8577 .8599 .8621 1.0 1.1 .8643 .8665…arrow_forwardFind the z-score for the given shaded region under the standard normal distribution. Round your answer to two decimal places. Shaded Area 0.66 -4 -3 -2 -1 3 Z-Score = Submit Questionarrow_forwardUse Table A-2 (Section 6.1) to find the probability: P(-1.20 z < 0.67) Round your answer to 3 decimal places.arrow_forward
- I got it wrong, please help with explanation step by step.arrow_forwardFind the area under the standard normal distribution curve between z=0 and z=−1.71. Attatched is the distribution table I am using. Thank you for your help!arrow_forwardTest the hypothesis using the P-value approach. Be sure to verify the requirements of the test Ho: p=0.5 versus H₁: p > 0.5 n = 250; x = 145; a = 0.1 Click here to view page 1 of the table Click here to view page 2 of the table Calculate the test statistic, Zo Zo (Round to two decimal places as needed.) = DE COOKarrow_forward
- Assume the readings on thermometers are normally distributed with a mean of 0°C and a standard deviation of 1.00°C. Find the probability that a randomly selected thermometer reads between -1.71 and -0.31 and draw a sketch of the region. Click to view page 1 of the table. Click to view page 2 of the table. Standard Normal Table (Page 1) Sketch the region. Choose the correct graph below. OA. -1.71 -0.31 The probability is (Round to four decimal places as needed.) OB. NEGATIVE Z Scores Standard Normal (z) Distribution: Cumulative Area from the LEFT .00 .01 02 .03 .04 .05 .06 .07 .08 .09 -1.71 -0.31 -3.50 and lower .0001 -3.4 0003 0003 -3.3 .0005 .0005 .0003 .0005 .0003 .0004 .0003 0004 .0003 .0003 .0003 .0003 .0002 .0004 .0004 .0004 .0004 .0003 -3.2 .0007 .0007 .0006 .0006 .0006 .0006 .0006 .0005 .0005 .0005 -3.1 .0010 .0009 .0009 .0009 .0008 .0008 .0008 .0008 .0007 .0007 -3.0 .0013 0013 .0013 0012 0012 .0011 .com .0011 0010 0010 -2.9 .0019 .0018 0018 .0017 0016 .0016 0015 .0015 0014…arrow_forwardFind the value of Z Tables of areas under the normal curve 20,22 Click the icon to view a table of areas under the normal curve. TABLE V 20,22 (Round to two decimal places as needed.) Standard Normal Distribution 02 00 01 03 04 05 06 Arse 0.0003 0.0004 0.0005 0.0002 0.0005 0.0005 0.0007 0.0010 0.0003 0.0003 0.0003 0.0005 0.0005 00005 0.0007 0.0010 0.0009 00009 00009 0.0013 00013 00013 0.0012 0.0003 0.0004 0.0004 0.0004 0.0006 0.0006G 00006 00005 0.0003 0.0004 0.0003 -34 -13 -3.2 -3.1 -1.0 00003 0.0003 0.0004 0.0006 0000 0.0007 0.0008 0.0008 0008 0008 0.0011 0.0007 0.0010 0.0012 0.0011 0001 -29 -28 -27 0.0019 0.00188 0.0018 0017 0.0016 0.0016 00015 00015 E2000 000 0.0023 0.0014 00014 0.0020 00019 0.0026 0.0027 0.0026 0.0025 0.0022 0.0021 G.0021 00035 00034 0033 00032 00031 0.0030 0.0029 0.0028 00047 0.0045 0.0044 0.0043 00041 0040 0.0039 0.008 0.0055 0037 0.0036 -26 -25 0.0049 0.0062 0.0060 0.0059 0.0057 0.0048 0.0066 00064 0.0087 0.0113 0011o 0.0150 0.0146 00143 0.0188 0.0183 -24 -23…arrow_forwardSTANDARD NORMAL DISTRIBUTION: Table Values Represent AREA to the LEFT of the Z score. Z .00 .01 .04 .05 .06 .07 .08 .09 .02 .03 .00004 .00004 00004 00004 .00003 .00003 -3.9 .00005 00005 -3.8 00007 .00007 .00007 .00006 .00006 .00005 .00004 .00004 00006 .00006 .00005 .00005 00008 .00012 .00012 .00011 -3.7 .00011 .00010 .00010 .00008 -3.6 .00016 .00015 .00015 .00010 .00009 .00009 00008 .00008 .00014 00014 .00013 .00013 .00020 .00019 .00029 .00028 00023 .00022 .00022 00021 .00019 00018 00017 .00017 -3.5 -3.4 .00034 .00032 .00031 .00030 .00027 .00026 .00025 -3.3 .00048 .00047 .00045 .00043 .00042 .00040 00039 .00038 .00036 -3.2 .00069 .00066 .00064 .00062 .00060 .00058 .00056 .00054 .00052 -3.1 .00097 ,00094 .00090 00084 .00082 .00079 .00076 .00074 -3.0 .00135 .00131 .00126 00118 ,00114 00111 .00107 .00104 -2.9 .00187 .00181 .00175 .00164 .00159 00154 .00149 .00144 00199 -2.8 .00256 .00248 .00240 .00226 .00205 -2.7 .00347 .00336 .00326 00307 .00280 .00272 00427 00415 .00379 .00368 -2.6…arrow_forward
- A quality control expert at LIFE batteries wants to test their new batteries. The design engineer claims they have a variance of 3364 with a mean life of 530 minutes. If the claim is true, in a sample of 75 batteries, what is the probability that the mean battery life would be greater than 533.2 minutes? Round your answer to four decimal places. Answer How to enter your answer (opens in new window) Tables Keypa Keyboard Shortcarrow_forwardA courier service company wishes to estimate the proportion of people in various states that will use its services. Suppose the true proportion is 0.06. If 305 are sampled, what is the probability that the sample proportion will be less than 0.08? Round your answer to four decimal places. Answer How to enter your answer (opens in new window) Tables E Keyboaarrow_forwardA survey of 2284 adults in a certain large country aged 18 and older conducted by a reputable polling organization found that 408 have donated blood in the past two years. Complete parts (a) through (c) below. Click here to view the standard normal distribution table (page 1). Click here to view the standard normal distribution table (page 2). (a) Obtain a point estimate for the population proportion of adults in the country aged 18 and older who have donated blood in the past two years. (Round to three decimal places as needed.) Standard Normal Distribution Table (page 1) %3 Area Standard Normal Distribution 0.00 0.01 0.02 0.03 0.04 0.05 0.06 0.07 0.08 0.09 -34 -33 -3.2 0.0003 0.0005 0.0007 0.0003 0.0005 0.0007 0.0003 0.0005 0.0006 0.0003 0.0004 0.0006 0.0003 0.0004 0.0006 0.0003 0.0004 0.0006 0.0003 0.0004 0.0006 0.0003 0.0004 0.0003 0.0004 0.0005 0.0007 0.0002 0.0003 0.0010 0.0013 0.0008 0.0011 0.0005 0.0008 0.0011 0.0005 0.0007 0.0009 0.0009 0.0009 0.0008 0.0008 -30 0.0013 0.0013…arrow_forward
arrow_back_ios
SEE MORE QUESTIONS
arrow_forward_ios
Recommended textbooks for you
- MATLAB: An Introduction with ApplicationsStatisticsISBN:9781119256830Author:Amos GilatPublisher:John Wiley & Sons Inc
 Probability and Statistics for Engineering and th...StatisticsISBN:9781305251809Author:Jay L. DevorePublisher:Cengage Learning
 Statistics for The Behavioral Sciences (MindTap C...StatisticsISBN:9781305504912Author:Frederick J Gravetter, Larry B. WallnauPublisher:Cengage Learning
  Elementary Statistics: Picturing the World (7th E...StatisticsISBN:9780134683416Author:Ron Larson, Betsy FarberPublisher:PEARSON
 The Basic Practice of StatisticsStatisticsISBN:9781319042578Author:David S. Moore, William I. Notz, Michael A. FlignerPublisher:W. H. Freeman
 Introduction to the Practice of StatisticsStatisticsISBN:9781319013387Author:David S. Moore, George P. McCabe, Bruce A. CraigPublisher:W. H. Freeman
MATLAB: An Introduction with Applications
Statistics
ISBN:9781119256830
Author:Amos Gilat
Publisher:John Wiley & Sons Inc
Probability and Statistics for Engineering and th...
Statistics
ISBN:9781305251809
Author:Jay L. Devore
Publisher:Cengage Learning
Statistics for The Behavioral Sciences (MindTap C...
Statistics
ISBN:9781305504912
Author:Frederick J Gravetter, Larry B. Wallnau
Publisher:Cengage Learning
Elementary Statistics: Picturing the World (7th E...
Statistics
ISBN:9780134683416
Author:Ron Larson, Betsy Farber
Publisher:PEARSON
The Basic Practice of Statistics
Statistics
ISBN:9781319042578
Author:David S. Moore, William I. Notz, Michael A. Fligner
Publisher:W. H. Freeman
Introduction to the Practice of Statistics
Statistics
ISBN:9781319013387
Author:David S. Moore, George P. McCabe, Bruce A. Craig
Publisher:W. H. Freeman