
A First Course in Probability (10th Edition)
10th Edition
ISBN: 9780134753119
Author: Sheldon Ross
Publisher: PEARSON
expand_more
expand_more
format_list_bulleted
Related questions
Question

Transcribed Image Text:Standard Normal Curve Areas (page 1)
The column under A gives the proportion
of the area under the entire curve that is
between z= 0 and a positive value of z.
A
z
A
z
A
0.60 0.226
0.122 0.61 0.229
z
0.00 0.000 0.30 0.118
0.01 0.004 0.31
0.02 0.008 0.32 0.126 0.62 0.232 0.92
0.03 0.012 0.33 0.129 0.63 0.236 0.93
0.04 0.016 0.34 0.133 0.64 0.239
0.05 0.020 0.35 0.137 0.65
0.06 0.024 0.36 0.141 0.66
0.07 0.028 0.37 0.144 0.67
0.08 0.032 0.38 0.148 0.68
0.94
0.242
0.95
0.245
0.96
0.249 0.97
0.09 0.036 0.39 0.152 0.69
0.10 0.040 0.40 0.155 0.70 0.258
0.11 0.044 0.41 0.159 0.71 0.261
0.12 0.048 0.42 0.163 0.72 0.264
0.13 0.052 0.43 0.166 0.73 0.267
0.270
0.14 0.056 0.44
0.060
0.15
0.45
0.273
0.16 0.064
0.067
0.071
0.075
0.17
0.18
0.19
0.26 0.103
0.27
0.48
0.49
0.20 0.079 0.50
0.21
0.083
0.52
0.087
0.22
0.23 0.091 0.53
0.24
0.25 0.099
0.095 0.54
0.55
1.94
1.95
1.96
1.97
1.98
1.99
2.00
0.46
0.47
0.198
0.202
0.205
0.209
0.56 0.212
0.106 0.57
0.216
0.110 0.58 0.219
0.222
0.59
2.05
2.06
0.170
0.174
Areas under the Normal Curve
s
0
z
z
0.475
0.476
0.476
0.477
0.477
0.478
0.177
0.181
0.184
0.188
0.191
0.51 0.195 0.81
The column under A gives the proportion
of the area under the entire curve that is
between z= 0 and a positive value of z.
2.01
2.02
2.03
2.04 0.479
0.480
0.480 2.36
2.37
2.38
2.39
0.478
0.479
0.74
0.75
2.07
0.481
2.08 0.481
2.00 0.482
0.82
0.83
0.84
0.85
0.86
0.87
0.88
0.89
0.76
0.276
1.06
0.77
0.279 1.07
0.78
0.282
0.79 0.285
0.80 0.288
0.291
0.28
0.29 0.114
Standard Normal Curve Areas (page 2)
0.252 0.98
0.255 0.99
1.00
1.01
0.294
0.297
0.90
0.91
2.61
2.62
2.63
0.490
0.490
2.33
2.64
2.34 0.490
0.491
2.35
2.65
0.491
2.66
0.491 2.67
0.491
2.68
0.492
2.69
1.02
1.03
1.08
1.09
0.496
0.496
0.496
1.10
1.11
0.300
0.302
0.305
0.308
1.17
0.311 1.18
0.313 1.19
0.496
0.496
1.12
1.13
1.14
1.15
1.16
A
0.316
0.319
0.321
0.324
0.341 1.30
0.403 1.60
0.344 1.31 0.405 1.61
0.346 1.32
0.348 1.33
1.04
0.351
1.05 0.353
Areas under the Normal Curve
0
Z
z
A
Z
A
Z
Z
2.73 0.497
A
A
1.80 0.464 2.10 0.482
2.40 0.492 2.70 0.497 3.00
1.81 0.465 2.11 0.483 2.41 0.492 2.71 0.497 3.01
1.82 0.466 2.12 0.483 2.42 0.492
2.72 0.497
1.83 0.466 2.13 0.483
2.43
0.492
1.84 0.467 2.14 0.484 2.44 0.493 2.74 0.497
1.85 0.468 2.15 0.484 2.45 0.493 2.75 0.497
1.86 0.469 2.16 0.485 2.46 0.493 2.76 0.497 3.06
1.87 0.469 2.17 0.485 2.47 0.493 2.77 0.497 3.07
0.485 2.48 0.493
1.89 0.471 2.19 0.486 2.49 0.494
1.88 0.470 2.18
1.90 0.471 2.20
1.91
1.92
2.22
0.473
1.93 0.473 2.23
0.474
0.474
0.355
0.358
Because the curve is symmetric
about 0, the area between z=0
and a negative value of z can be
found by using the corresponding
positive value of z.
2
0.496
0.496
0.496 2.99
z
1.20
1.21
1.22
1.23
0.326
0.329
0.331 1.26 0.396 1.56
0.334 1.27
0.398
1.57
0.336 1.28
0.400 1.58
0.339 1.29
0.401 1.59
0.389
1.52
0.391 1.53
1.24
0.393
1.25 0.394
1.66
1.67
1.68
1.69
0.364
1.70
0.367
0.421 1.71
0.369
0.422 1.72
0.371
0.424
1.73
0.373 1.44 0.425
1.74
0.375
1.45
0.426
0.377 1.46
0.428
0.379
0.429 1.77
0.381
0.431
1.78
0.383
0.432 1.79
1.36
1.37
2.80
0.486 2.50 0.494
0.472 2.21 0.486
2.51 0.494 2.81
0.487 2.52 0.494 2.82 0.498 3.12 0.499
0.487 2.53 0.494 2.83 0.498
2.84 0.498
0.495 2.85 0.498
0.487
2.24
3.13 0.499
3.14 0.499
3.15 0.499
2.54 0.494
2.55
2.56
2.25 0.488
2.26
0.488
0.495 2.86
0.498
2.27
0.488
2.57
0.495
2.87
0.498
2.28
0.489
2.58
0.495
2.88
0.498
2.29
0.489
2.59
0.495 2.89
0.498
2.30
0.489
2.60
0.495 2.90
2.31
0.490
0.495
2.91
2.32
2.92
2.93
2.94
2.95
2.97 0.499
2.98 0.499
0.499
A
z
0.385 1.50
0.387 1.51
0.360 1.38
0.362
1.39
0.419
1.40
1.41
1.42
1.43
1.47
1.48
1.49
0.407 1.62 0.447
0.408 1.63
1.34 0.410 1.64
1.35 0.411
1.65
0.413
0.415
3.16
3.17
0.416
0.418
0.498
0.498
3.22
0.498
3.23
0.498
3.24
0.498 3.25
3.26
3.27
3.28
3.29
0.498
2.96
1.54
1.55
3.20
0.498
3.21
Because the curve is symmetric
about 0, the area between z=0
and a negative value of z can be
found by using the corresponding
positive value of z.
Z
A
0.499 3.30
0.499 3.31
3.32
3.33
1.75
1.76
3.02 0.499
3.03 0.499
3.04 0.499 3.34 0.500
3.05 0.499 3.35
0.500
0.500
0.500
0.499 3.36
0.499 3.37
2.78 0.497 3.08 0.499
3.38
0.500
3.09 0.499 3.39 0.500
2.79
0.497
0.497 3.10 0.499 3.40 0.500
0.498 3.11 0.499 3.41
0.500
3.42
0.500
3.43
0.500
3.44
0.500
3.45
0.500
0.499 3.46
0.500
0.499 3.47
0.500
3.18
0.499
3.48
3.19 0.499 3.49
0.499
3.50
0.499
3.51
0.499
3.52
0.499
A
0.433
0.434
0.436
0.437
0.438
0.439
0.441
0.442
0.443
0.444
0.499
0.499
0.499
0.445
0.446
0.499 3.54
0.448
0.449
0.451
0.452
0.453
0.454
0.454
0.455
0.456
0.457
0.458
0.459
0.460
0.461
0.462
0.462
0.463
A
0.500
0.500
0.500
0.500
0.500
0.500
0.500
0.500
0.500
3.53 0.500
0.500
0.500
0.500
3.55
0.499
0.499
3.56
3.57
3.58
3.59
0.500
0.500
0.500

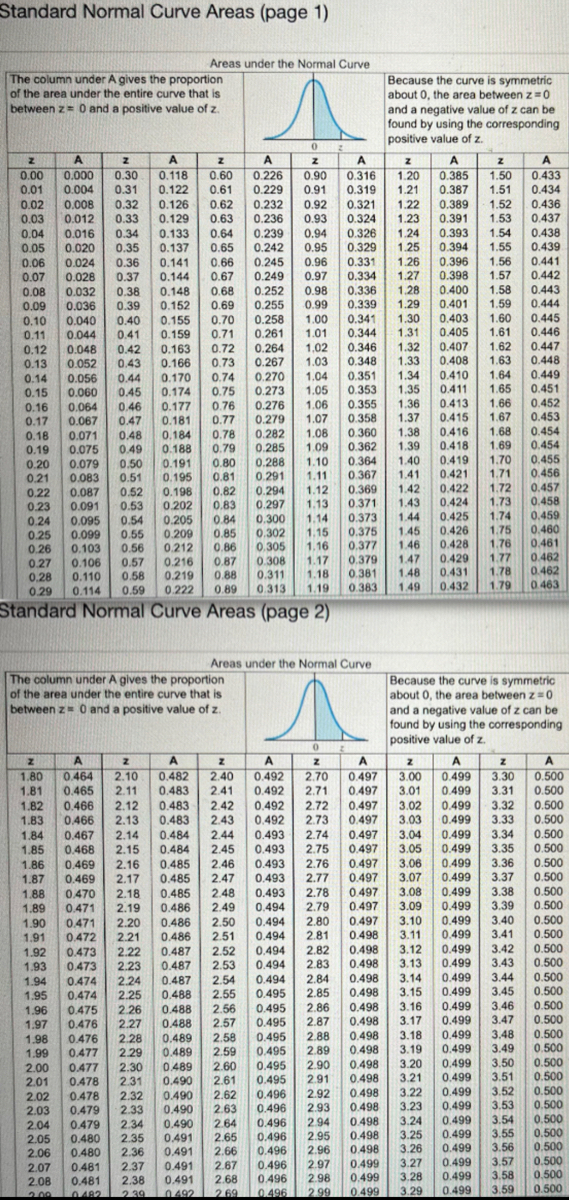
Transcribed Image Text:In nutrition, the recommended daily allowance of vitamins is a number set by the government to guide an individual's daily vitamin intake. Actually, vitamin needs vary drastically from person
to person, but the needs are closely approximated by a normal curve. To calculate the recommended daily allowance, the government first finds the standard deviation and the average need for
vitamins among people in the population. The recommended daily allowance is then defined as the mean plus 2.4 times the standard deviation. What fraction of the population will receive adequate
amounts of vitamins under this plan?
Click here to see page 1 of the table for areas under the standard normal curve.
Click here to see page 2 of the table for areas under the standard normal curve
CID
The fraction of the population that will receive adequate amounts of vitamins under the given plan is
(Type an integer or decimal rounded to the nearest thousandth as needed.).
Expert Solution
This question has been solved!
Explore an expertly crafted, step-by-step solution for a thorough understanding of key concepts.

This is a popular solution

Trending nowThis is a popular solution!

Step by stepSolved in 3 steps with 2 images

Knowledge Booster

Similar questions
- score: 0.35 ol 1 pt mplete) HW Score: 17.957o, 2.35 7.1.31 Question Help Suppose the monthly charges for cell phone plans are normally distributed with mean µ = $56 and standard deviation o= $18. (a) Draw a normal curve with the parameters labeled. (b) Shade the region that represents the proportion of plans that charge less than $38. (c) Suppose the area under the normal curve to the left of X = $38 is 0.1587. Provide an interpretation of this result. X X 20 38 56 20 56 92 38 56 74 56 74 92 (b) Choose the correct graph below. A. O B. OD. 38- 38 X 56 74 92 20 38 56 38 56 74 20 56 92 (c) Select the correct choice below and fill in the answer box to complete your choice. (Type a whole number.) O A. The probability is 0.1587 that a randomly selected cell phone plan in this population is less than $ per month. O B. The probability is 0.1587 that a randomly selected cell phone plan in this population is more than $ per month.arrow_forwardAnswer C-Darrow_forwardDirections: Determine the area under the standard normal curve that lies. 1. between z = 0 and z = 2.47 6. between z = -2.06 and z = -0.54 Area: Area: 2. between z = -1.85 and z 0 7. to the left of z = 1.53 Area: Area: 3. to the right of z = 0.61 8. to the right of z = -1.34 Area: Area: 4. to the left of z = -3.02 9. betweenz = -2.09 and z = 1.72 Area: Area: 10. to the left of z = -1.27 and to the right of z = 2.86 5. between z= 1.11 and z = 2.75 Area: Area:arrow_forward
- Find the z value such that 93% of the standard normal curve lies between -z and z. (Round your answer to two decimal places.) A USE SALT Sketch the area described. -Z -Zarrow_forwardK ...docx ikk Z Find the area of the shaded region. The graph depicts the standard normal distribution of bone density scores with mean 0 and standard deviation 1. The area of the shaded region is. (Round to four decimal places as needed.) @ 2 D 2Demo Outline....docx p F2 W S X H command # 3 80 F3 E D C $ 4 R F chapt21 lecture....pdf % 5 V FS T G 6 MacBook Air B F6 Y chapt22_Jecture....pdf H 7 U N * 8 J A Dil FB 1 M ( 9 K chapt23_lecture....pdf DD O I H ) O L P command Time Remaining: 00:17:31 Next > : ; t FR { + [ option - ? z = -0.99 z 1.28 11 1 I Show All 1 1 x Q a delete retuarrow_forwardHelp please. Show workings please. Determine the area under the standard normal curve that lies to the left of (a) Z=−1.48, (b) Z=1.01, (c) Z=1.69, and (d) Z=−0.24. (a) The area to the left of Z=−1.48 is nothing. (Round to four decimal places as needed.)arrow_forward
- Part 1 of 2 Español (a) The standard normal curve is graphed below. Shade the region under the standard normal curve to the left of z=2.00. 0.3- 0.2- 0.1+ Part 2 of 2 (b) Use this table or the ALEKS calculator to find the area under the standard normal curve to the left of z= 2.00. Give your answer to four decimal places (for example, 0.1234). Save For Later Submit Assignment Check 2022 McGraw Hill LLC. All Rights Reserved. Terms of Use I Privacy Center | Accessibility DII DO 80 a F6 F7 19 esc F3 F4 F2 & %23 6 7 8. delete 1 2 3 4 T Y U Q tab F G H K yRMDarrow_forwardHelp Answerarrow_forwardFind z such that 5.5% of the standard normal curve lies to the right of z. (Round your answer to two decimal places.)z = Sketch the area described.arrow_forward
- (a) The standard normal is graphed below. Shade the region under the standard normal curve to the left of z=1.50. 0.4 0.3- 02+ 0.1- Part 2 of 2 (b) Use this table or the ALEKS calculator to find the area under the standard normal curve to the left of z=1.50. Give your answer to four decimal places (for example, 0.1234).arrow_forwardSketch the area under the standard normal curve over the indicated interval and find the specified area. (Enter a number. Round your answer to four decimal places.) The area to the left of z = 0.41 is _________________arrow_forwardK e this Determine the area under the standard normal curve that lies to the right of (a) Z= -0.22, (b) Z= -1.58, (c) Z=0.87, and (d) Z=0.56. (a) The area to the right of Z=-0.22 is (Round to four decimal places as needed.) View an example Get more help - a J i C 1) L 3 CI Clear all Checkarrow_forward
arrow_back_ios
SEE MORE QUESTIONS
arrow_forward_ios
Recommended textbooks for you
- A First Course in Probability (10th Edition)ProbabilityISBN:9780134753119Author:Sheldon RossPublisher:PEARSON

A First Course in Probability (10th Edition)
Probability
ISBN:9780134753119
Author:Sheldon Ross
Publisher:PEARSON