
MATLAB: An Introduction with Applications
6th Edition
ISBN: 9781119256830
Author: Amos Gilat
Publisher: John Wiley & Sons Inc
expand_more
expand_more
format_list_bulleted
Related questions
Concept explainers
Question
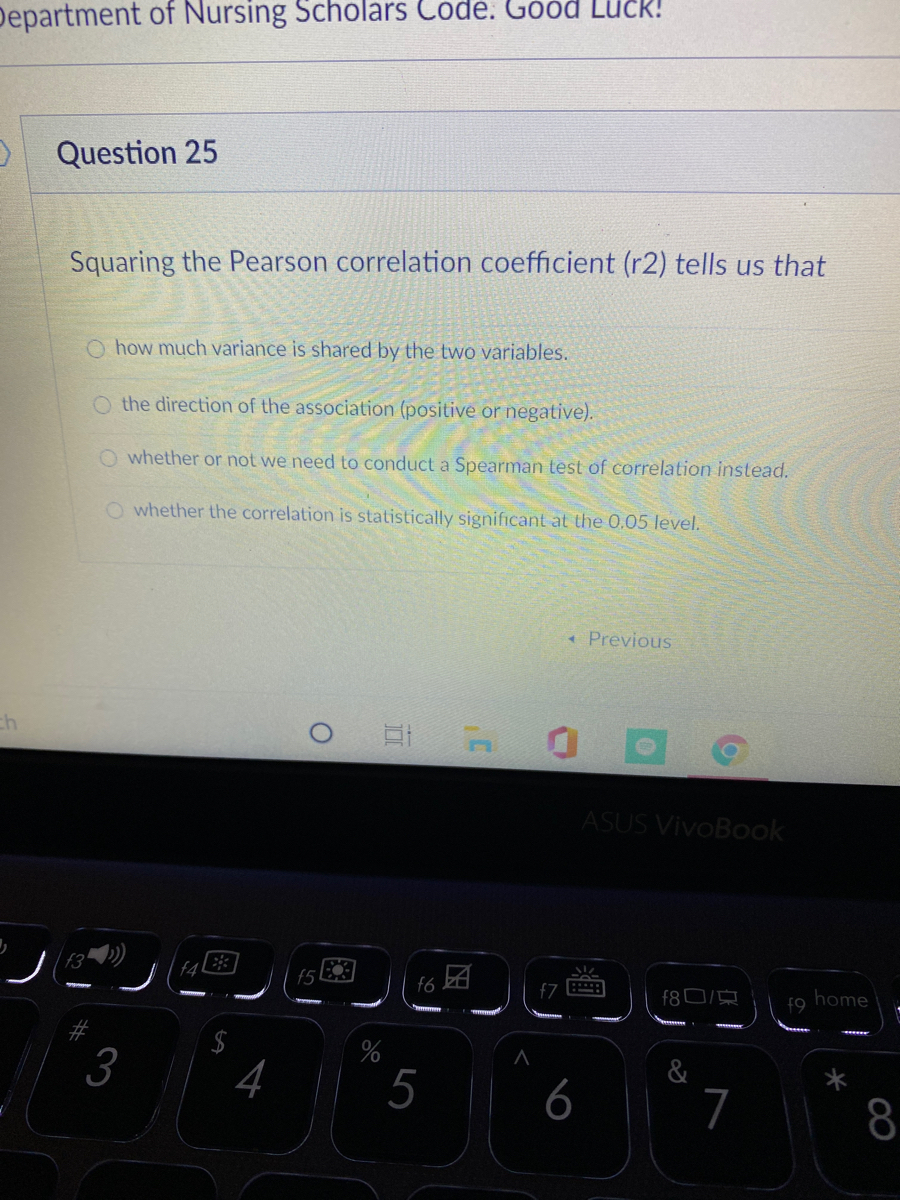

Transcribed Image Text:Department of Nursing Scholars Code. Good Luck!
Question 25
Squaring the Pearson correlation coefficient (r2) tells us that
O how much variance is shared by the two variables.
O the direction of the association (positive or negative).
O whether or not we need to conduct a Spearman test of correlation instead.
O whether the correlation is statistically significant at the 0.05 level.
* Previous
ASUS VivoBook
,囝
f6
f80/
home
f9
%
3
4
5
6
&
7
8
%24
Expert Solution
This question has been solved!
Explore an expertly crafted, step-by-step solution for a thorough understanding of key concepts.

Step by stepSolved in 2 steps

Knowledge Booster


Learn more about
Need a deep-dive on the concept behind this application? Look no further. Learn more about this topic, statistics and related others by exploring similar questions and additional content below.Similar questions
- Research was conducted on the amount of training for 5K race and the time a contestant took to run the race. The researcher recorded the number of miles a contestant ran during the last month of training and the time it took the contestant to complete the 5K. The results are below. Miles Trained 65 78 90 91 104 112 Time (Minutes) 23 26 34 39 42 50 (a) Give the correlation coefficient. Round to one decimal place. (b) Use technology to write the regression equation that predicts the time it takes a contestant to complete the race by using the miles trained as the explanatory variable. Complete the missing parts of the equation below, rounding values to one decimal place. ý (c) Interpret the y-intercept in the context of this scenario. O Each additional mile of training reduces the time needed to complete the 5K by 0.6 minutes. A contestant who has not trained at all in the last month can expect to complete the 5K in 0.6 minutes. X O A contestant who has not trained at all in the last…arrow_forwardWould A be the answer?arrow_forwardResearch was conducted on the amount of training for 5K and the time a contestant took to run the race. The researcher recorded the number of miles during training ( a 1 month period) and the time to complete the 5K. The results are below. Miles Trained 45 77 37 25 60 64 Time (Minutes) 32.9 28 36.2 27.5 19.5 18.3 a) Give the correlation coefficient. r = b) Give the equation of the regression line. Round the values to 4 deimal places.This is in the form y = ax + b, so the slope goes in the first box and the y-inercept in the 2nd box.y = x + c) Interpret the y-intercept (Explain it's meaning, do not just give its value.)d) Predict the time in the 5K if someone trained 37 miles.Use the rounded values entered for the slope and intercept of the regression line to compute the predicted y-value.y = e) Give the residual for 37 miles trained.This is the actual y value for the runner who trained for miles minus the predicted value.Residual=arrow_forward
- Interpret the Correlation Coefficient -0.9 It is Strong Positive It is Weak Negative It is Weak Positive It is Strong Negativearrow_forwardWhat information is provided by r2? What are the primary uses of partial correlations?arrow_forwardSquaring the Pearson correlation coefficient (r2) tells us thatarrow_forward
- What does it mean if the linear correlation coefficient is A) 0? B) -1?arrow_forwardThe correlation coefficient between variables X and Y is 0.62. What does this signify? Question 8Answer a. When Y increases 1, X increases by 0.62 b. When X increases by 1, Y increases by 0.62 c. The variance shared by X and Y is less 20% d. The variance shared by X and Y is 62%arrow_forwardAfter gathering data about the number of starfish and measuring the pollution in areas of the ocean you find a negative linear correlation between pollution levels and number of starfish. What can you conclude based on this information? a. There is a confounding variable that is affecting both pollution and starfish. b. As pollution rises the number of starfish falls c. That pollution is causing starfish to die, leading to the negative correlation d. That pollution is supporting starfish, leading to the negative correlationarrow_forward
arrow_back_ios
arrow_forward_ios
Recommended textbooks for you
- MATLAB: An Introduction with ApplicationsStatisticsISBN:9781119256830Author:Amos GilatPublisher:John Wiley & Sons Inc
 Probability and Statistics for Engineering and th...StatisticsISBN:9781305251809Author:Jay L. DevorePublisher:Cengage Learning
 Statistics for The Behavioral Sciences (MindTap C...StatisticsISBN:9781305504912Author:Frederick J Gravetter, Larry B. WallnauPublisher:Cengage Learning
  Elementary Statistics: Picturing the World (7th E...StatisticsISBN:9780134683416Author:Ron Larson, Betsy FarberPublisher:PEARSON
 The Basic Practice of StatisticsStatisticsISBN:9781319042578Author:David S. Moore, William I. Notz, Michael A. FlignerPublisher:W. H. Freeman
 Introduction to the Practice of StatisticsStatisticsISBN:9781319013387Author:David S. Moore, George P. McCabe, Bruce A. CraigPublisher:W. H. Freeman
MATLAB: An Introduction with Applications
Statistics
ISBN:9781119256830
Author:Amos Gilat
Publisher:John Wiley & Sons Inc
Probability and Statistics for Engineering and th...
Statistics
ISBN:9781305251809
Author:Jay L. Devore
Publisher:Cengage Learning
Statistics for The Behavioral Sciences (MindTap C...
Statistics
ISBN:9781305504912
Author:Frederick J Gravetter, Larry B. Wallnau
Publisher:Cengage Learning
Elementary Statistics: Picturing the World (7th E...
Statistics
ISBN:9780134683416
Author:Ron Larson, Betsy Farber
Publisher:PEARSON
The Basic Practice of Statistics
Statistics
ISBN:9781319042578
Author:David S. Moore, William I. Notz, Michael A. Fligner
Publisher:W. H. Freeman
Introduction to the Practice of Statistics
Statistics
ISBN:9781319013387
Author:David S. Moore, George P. McCabe, Bruce A. Craig
Publisher:W. H. Freeman