
MATLAB: An Introduction with Applications
6th Edition
ISBN: 9781119256830
Author: Amos Gilat
Publisher: John Wiley & Sons Inc
expand_more
expand_more
format_list_bulleted
Related questions
Question
Give a statistical interperation of the data
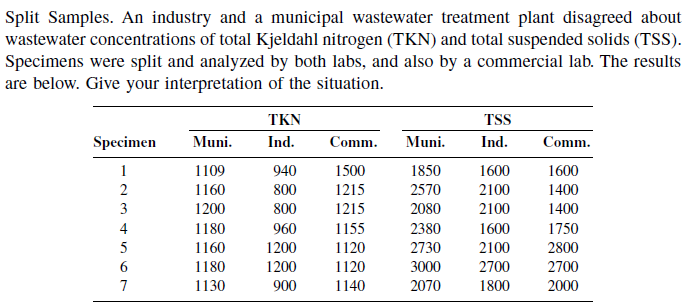

Transcribed Image Text:Split Samples. An industry and a municipal wastewater treatment plant disagreed about
wastewater concentrations of total Kjeldahl nitrogen (TKN) and total suspended solids (TSS).
Specimens were split and analyzed by both labs, and also by a commercial lab. The results
are below. Give your interpretation of the situation.
Specimen
1
234567
7
Muni.
1109
1160
1200
1180
1160
1180
1130
TKN
Ind.
Comm.
940
1500
800
1215
800
1215
960
1155
1200
1120
1200
1120
900 1140
Muni.
1850
2570
2080
2380
2730
3000
2070
TSS
Ind.
1600
2100
2100
1600
2100
2700
1800
Comm.
1600
1400
1400
1750
2800
2700
2000
Expert Solution
This question has been solved!
Explore an expertly crafted, step-by-step solution for a thorough understanding of key concepts.

Step by stepSolved in 2 steps

Knowledge Booster

Similar questions
- Define the term relationship as a perfect positive cross-correlation?arrow_forwardCan you help me out by showing me an example of a weak positive correlation scatter plot? with a relistic example that shows the two variables that demonstrate this pattern?arrow_forwardHow is correlation defined?arrow_forward
- estion 3 of 38 university and gathers their freshman year GPA data and the high school SAI score reported on each of their college applications. He produces a scatterplot with SAT scores on the horizontal axis and GPA on the vertical axis. The data has a linear correlation coefficient of 0.506701. Additional sample statistics are summarized in the table below. Variable Sample Sample standard Variable description mean deviation high school SAT score x 1504.291401 Sx = 105.782904 %3D y freshman year GPA y = 3.240805 Sy = 0.441205 r = 0.506701 slope 0.002113 Determine the y-intercept, a, of the least-squares regression line for this data. Give your answer precise to at least four decimal places. tems of use Thelp about us குசங் careers 2:30 PM 10/24/20 o耳 国 @ hparrow_forwardExplain what restriction of range is and what it tends to do to the magnitude of a correlation.arrow_forwardExplain correlation and its importance.arrow_forward
arrow_back_ios
SEE MORE QUESTIONS
arrow_forward_ios
Recommended textbooks for you
- MATLAB: An Introduction with ApplicationsStatisticsISBN:9781119256830Author:Amos GilatPublisher:John Wiley & Sons Inc
 Probability and Statistics for Engineering and th...StatisticsISBN:9781305251809Author:Jay L. DevorePublisher:Cengage Learning
 Statistics for The Behavioral Sciences (MindTap C...StatisticsISBN:9781305504912Author:Frederick J Gravetter, Larry B. WallnauPublisher:Cengage Learning
  Elementary Statistics: Picturing the World (7th E...StatisticsISBN:9780134683416Author:Ron Larson, Betsy FarberPublisher:PEARSON
 The Basic Practice of StatisticsStatisticsISBN:9781319042578Author:David S. Moore, William I. Notz, Michael A. FlignerPublisher:W. H. Freeman
 Introduction to the Practice of StatisticsStatisticsISBN:9781319013387Author:David S. Moore, George P. McCabe, Bruce A. CraigPublisher:W. H. Freeman
MATLAB: An Introduction with Applications
Statistics
ISBN:9781119256830
Author:Amos Gilat
Publisher:John Wiley & Sons Inc
Probability and Statistics for Engineering and th...
Statistics
ISBN:9781305251809
Author:Jay L. Devore
Publisher:Cengage Learning
Statistics for The Behavioral Sciences (MindTap C...
Statistics
ISBN:9781305504912
Author:Frederick J Gravetter, Larry B. Wallnau
Publisher:Cengage Learning
Elementary Statistics: Picturing the World (7th E...
Statistics
ISBN:9780134683416
Author:Ron Larson, Betsy Farber
Publisher:PEARSON
The Basic Practice of Statistics
Statistics
ISBN:9781319042578
Author:David S. Moore, William I. Notz, Michael A. Fligner
Publisher:W. H. Freeman
Introduction to the Practice of Statistics
Statistics
ISBN:9781319013387
Author:David S. Moore, George P. McCabe, Bruce A. Craig
Publisher:W. H. Freeman