
MATLAB: An Introduction with Applications
6th Edition
ISBN: 9781119256830
Author: Amos Gilat
Publisher: John Wiley & Sons Inc
expand_more
expand_more
format_list_bulleted
Related questions
Question
Estimate the
write your solution clearly. thanks
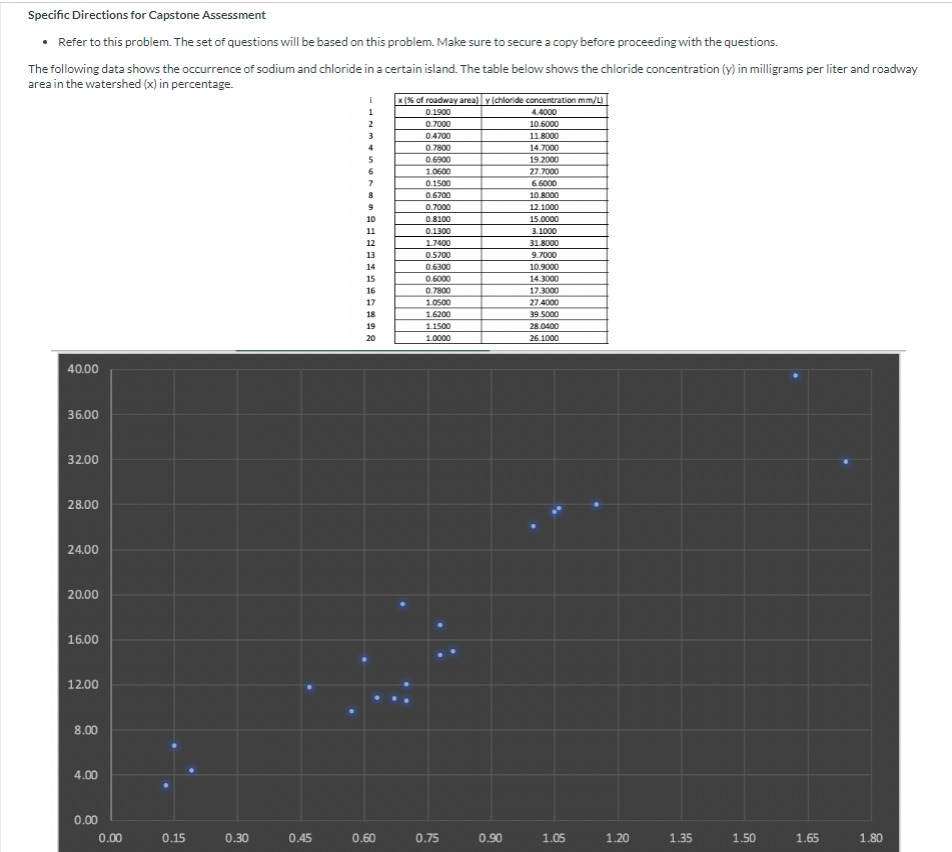

Transcribed Image Text:Specific Directions for Capstone Assessment
• Refer to this problem. The set of questions will be based on this problem. Make sure to secure a copy before proceeding with the questions.
The following data shows the occurrence of sodium and chloride in a certain island. The table below shows the chloride concentration (y) in milligrams per liter and roadway
area in the watershed (x) in percentage.
40.00
36.00
32.00
28.00
24.00
20.00
16.00
12.00
8.00
4.00
0.00
0.00
0.15
0.30
0.45
i
1
2
3
4
5
6
7
8
9
10
11
12
13
14
15
16
17
18
19
20
0.60
x (% of roadway area) y (chloride concentration mm/L)
0.1900
0.7000
4.4000
10.6000
0.4700
11.8000
0.7800
14.7000
0.6900
19.2000
1.0600
27.7000
0.1500
6.6000
0.6700
10.8000
0.7000
0.8100
0.130
1.7400
0.5700
0.6300
0.6000
0.7800
1.0500
1.6200
1.1500
1.0000
0.75
0.90
12.1000
15.0000
3.1000
31.8000
9.7000
10.9000
14.3000
17.3000
27.4000
39.5000
28.0400
26.1000
1.05
1.20
1.35
1.50
1.65
1.80
Expert Solution
This question has been solved!
Explore an expertly crafted, step-by-step solution for a thorough understanding of key concepts.

Step by stepSolved in 2 steps with 2 images

Knowledge Booster

Similar questions
- just provide answer please :) thankyouarrow_forwardAt Community Hospital, each full-time employee is required to work 2,080 hours annually. The table below shows the amount of time that four employees were absent from work over the past year. Employee Name Vacation Hours Used Sick Leave Hours Used A 40 6 B 22 16 C 36 8 D 80 32 E 16 40 a. What is the sick leave rate for each employee?arrow_forwardSA = 2rr2 + 2rh (Use 3.14 for T.) SA%3D 6 in. Find the surface area of a 8 in. cylinder with a height of 8 inches and base diameter of 6 inches. square inches If you'd like, Do NOT round your answer. calculator. e esn ue nou Ehter ademy of Science. All Rights Reserved. smos | Scientific ZENworks Applicati.. Word (Beta) | Micro...arrow_forward
- Tyler looks at a map on his phone. He zooms in until the map scale for cenimeters to kilometers 0.3:1/5. How many cenimeters does this map use to show 1 kilometer?arrow_forwardSTING #0 Stu... X M ClassMarker - Test Amazon SNYS DMV- My DMV Stop 7. Answer the question. Step & Check: We leave it to you to check your calculations, 14.udemy NYC HEALTH +HOS.... S=150.72 The surface area is approximately 150.72 squaro inchos. After reviewing this information, solve the following question. O A. Surface Area = 377.76 square feet Volume = 754.56 cubic feet Find the volume and surface area of a tube that has the shape of a cylinder with radius 4 feet and height 19 feet (round your answer to two decimal places). OB. Surface Area = 577.76 square feet Volume = 954.56 cubic feet O C. Surface Area = 477.76 square feet Volume = 884.56 cubic feet Tennu Le [Full Song]-Jai Ve OD. Surface Area = 411.76 square feet Volume = 874.56 cubic feet E. Surface Area = 677.76 square feet Volume = 957.56 cubic feet SAMSUNG LaGuardia VIP (Log..arrow_forwardPlease calculate the 95% CI for Juv Males and Juv Females for each river. Also provide the excel formulas used. Thank youarrow_forward
arrow_back_ios
arrow_forward_ios
Recommended textbooks for you
- MATLAB: An Introduction with ApplicationsStatisticsISBN:9781119256830Author:Amos GilatPublisher:John Wiley & Sons Inc
 Probability and Statistics for Engineering and th...StatisticsISBN:9781305251809Author:Jay L. DevorePublisher:Cengage Learning
 Statistics for The Behavioral Sciences (MindTap C...StatisticsISBN:9781305504912Author:Frederick J Gravetter, Larry B. WallnauPublisher:Cengage Learning
  Elementary Statistics: Picturing the World (7th E...StatisticsISBN:9780134683416Author:Ron Larson, Betsy FarberPublisher:PEARSON
 The Basic Practice of StatisticsStatisticsISBN:9781319042578Author:David S. Moore, William I. Notz, Michael A. FlignerPublisher:W. H. Freeman
 Introduction to the Practice of StatisticsStatisticsISBN:9781319013387Author:David S. Moore, George P. McCabe, Bruce A. CraigPublisher:W. H. Freeman
MATLAB: An Introduction with Applications
Statistics
ISBN:9781119256830
Author:Amos Gilat
Publisher:John Wiley & Sons Inc
Probability and Statistics for Engineering and th...
Statistics
ISBN:9781305251809
Author:Jay L. Devore
Publisher:Cengage Learning
Statistics for The Behavioral Sciences (MindTap C...
Statistics
ISBN:9781305504912
Author:Frederick J Gravetter, Larry B. Wallnau
Publisher:Cengage Learning
Elementary Statistics: Picturing the World (7th E...
Statistics
ISBN:9780134683416
Author:Ron Larson, Betsy Farber
Publisher:PEARSON
The Basic Practice of Statistics
Statistics
ISBN:9781319042578
Author:David S. Moore, William I. Notz, Michael A. Fligner
Publisher:W. H. Freeman
Introduction to the Practice of Statistics
Statistics
ISBN:9781319013387
Author:David S. Moore, George P. McCabe, Bruce A. Craig
Publisher:W. H. Freeman