MATLAB: An Introduction with Applications
6th Edition
ISBN: 9781119256830
Author: Amos Gilat
Publisher: John Wiley & Sons Inc
expand_more
expand_more
format_list_bulleted
Topic Video
Question
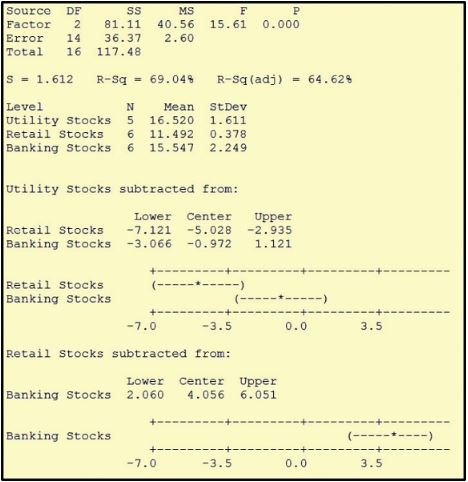
See Image
A stock analyst wants to determine whether there is a difference in the
- What is the critical value?
- What is the test statistic?
- Can the analyst conclude there is a difference between the mean rates of return for utility & retail stocks? For utility & banking stocks? For banking and retail stocks? (negative value should be indicated by a minus sign)

Transcribed Image Text:Source
DF
SS
MS
Factor
81.11
40.56
15.61
0.000
Error
14
36.37
2.60
Total
16
117.48
S = 1.612
R-Sq = 69.04%
R-Sq (adj) = 64.62%
Level
Utility Stocks 5
Retail Stocks
Banking Stocks 6
Mean
StDev
16.520
1.611
11.492
15.547
0.378
2.249
6.
Utility Stocks subtracted from:
Upper
-7.121 -5.028 -2.935
Lower Center
Retail Stocks
Banking Stocks -3.066 -0.972
1.121
-------+-
Retail Stocks
Banking Stocks
-------)
(-----*-----)
-------
-7.0
-3.5
0.0
3.5
Retail stocks subtracted from:
Lower Center Upper
4.056 6.051
Banking Stocks 2.060
Banking Stocks
(-----+----)
-7.0
-3.5
0.0
3.5
Expert Solution
This question has been solved!
Explore an expertly crafted, step-by-step solution for a thorough understanding of key concepts.
This is a popular solution
Trending nowThis is a popular solution!
Step by stepSolved in 5 steps with 9 images

Knowledge Booster
Learn more about
Need a deep-dive on the concept behind this application? Look no further. Learn more about this topic, statistics and related others by exploring similar questions and additional content below.Similar questions
- find 2nd percentile for given data 12,15,4,69,85,63,34,75,62,69,74,52,16,46,42arrow_forwardHow to determine Percentile, Quartile, Outliers? Give examples.arrow_forwardInterpret the mean, median, and mode results using this table. Descriptions: Landfill is the number of disposal sites for solid wastes to be recycled. In the process, it entails soil destruction, thus, emitting greenhouse gases. Acid pertains to the emission of sulfur dioxide and nitrogen oxide measured in thousand tons. This results from the burning of fuels by electric utilities or utility coal consumption which is considered as a contributor to the greenhouse emission. Greenhouse is the amount of greenhouse gases in their carbon monoxide equivalent in terms of heating value, wherein heating value is the amount of heat trapped by CO2, measured in million tons.arrow_forward
- What are the mean and variance for the below data 73,73,73,51arrow_forwardWhy Mode value is one of the given set of data values?arrow_forwardA retail survey asked college students how much they planned to spend in various categories during the upcoming academic year. One category is the amount students planned to spend on school supplies. The data below show the amount of money students planned to spend on school supplies. 58, 60, 67, 69, 70, 73, 74, 77, 78, 80, 83, 84, 87, 89, 94, 96, 97, 100, 102, 105 USE SALT (a) Calculate the mean and median for the distribution of money students planned to spend on school supplies. mean median (b) What is the 75th percentile of the distribution? (c) Determine the five-number summary. minimum Q₁ median Q3 maximumarrow_forward
- Mean = 64.57 median = 64.50 mode = 64.09 comment on the shape of the distribution. Give reasons for your answer.arrow_forwardThe chart below represents the number of inches of snow for a seven-day period. Sunday Monday Tuesday Wednesday Thursday Friday Saturday 2 5 3 10 0 4 2 Find the mean, median, and mode. Which is the best measure of central tendency? Remove Wednesday from the calculations. How does that impact the three measures of central tendency? Describe the effect outliers have on the measures of central tendency.arrow_forwardCalculation of a mean is most appropriate for which of the following sets of data? Attitudes of graduate nurses toward the elderly measured by axillary temperature Ranking of nursing students by clinical instructors according to perceived technical ability. Percent of nurses in each specialty area.arrow_forward
- Determine the mode, median, and mean for the following data: -7,5,-4, -11, 19, -3, -5, -10,-10 Mode = Median ← - Mean Round to 2 decimal places SUBMIT QUESTION SAVE PROGRESSarrow_forwardUngrouped data: 12, 34, 28, 26, 32, 28, 40, 36 What percentage of values is below the mean? What is the difference between the median and the range?arrow_forward
arrow_back_ios
arrow_forward_ios
Recommended textbooks for you
 MATLAB: An Introduction with ApplicationsStatisticsISBN:9781119256830Author:Amos GilatPublisher:John Wiley & Sons Inc
 Probability and Statistics for Engineering and th...StatisticsISBN:9781305251809Author:Jay L. DevorePublisher:Cengage Learning
 Statistics for The Behavioral Sciences (MindTap C...StatisticsISBN:9781305504912Author:Frederick J Gravetter, Larry B. WallnauPublisher:Cengage Learning
 Elementary Statistics: Picturing the World (7th E...StatisticsISBN:9780134683416Author:Ron Larson, Betsy FarberPublisher:PEARSON
 The Basic Practice of StatisticsStatisticsISBN:9781319042578Author:David S. Moore, William I. Notz, Michael A. FlignerPublisher:W. H. Freeman
 Introduction to the Practice of StatisticsStatisticsISBN:9781319013387Author:David S. Moore, George P. McCabe, Bruce A. CraigPublisher:W. H. Freeman

MATLAB: An Introduction with Applications
Statistics
ISBN:9781119256830
Author:Amos Gilat
Publisher:John Wiley & Sons Inc

Probability and Statistics for Engineering and th...
Statistics
ISBN:9781305251809
Author:Jay L. Devore
Publisher:Cengage Learning

Statistics for The Behavioral Sciences (MindTap C...
Statistics
ISBN:9781305504912
Author:Frederick J Gravetter, Larry B. Wallnau
Publisher:Cengage Learning

Elementary Statistics: Picturing the World (7th E...
Statistics
ISBN:9780134683416
Author:Ron Larson, Betsy Farber
Publisher:PEARSON

The Basic Practice of Statistics
Statistics
ISBN:9781319042578
Author:David S. Moore, William I. Notz, Michael A. Fligner
Publisher:W. H. Freeman

Introduction to the Practice of Statistics
Statistics
ISBN:9781319013387
Author:David S. Moore, George P. McCabe, Bruce A. Craig
Publisher:W. H. Freeman