
MATLAB: An Introduction with Applications
6th Edition
ISBN: 9781119256830
Author: Amos Gilat
Publisher: John Wiley & Sons Inc
expand_more
expand_more
format_list_bulleted
Related questions
Question
In the accompanying Sales transactions data, use Excels filtering capability to extract:
a: all orders that used PayPal
b: all orders under $100
c: all orders that were over $100 and used a credit card.
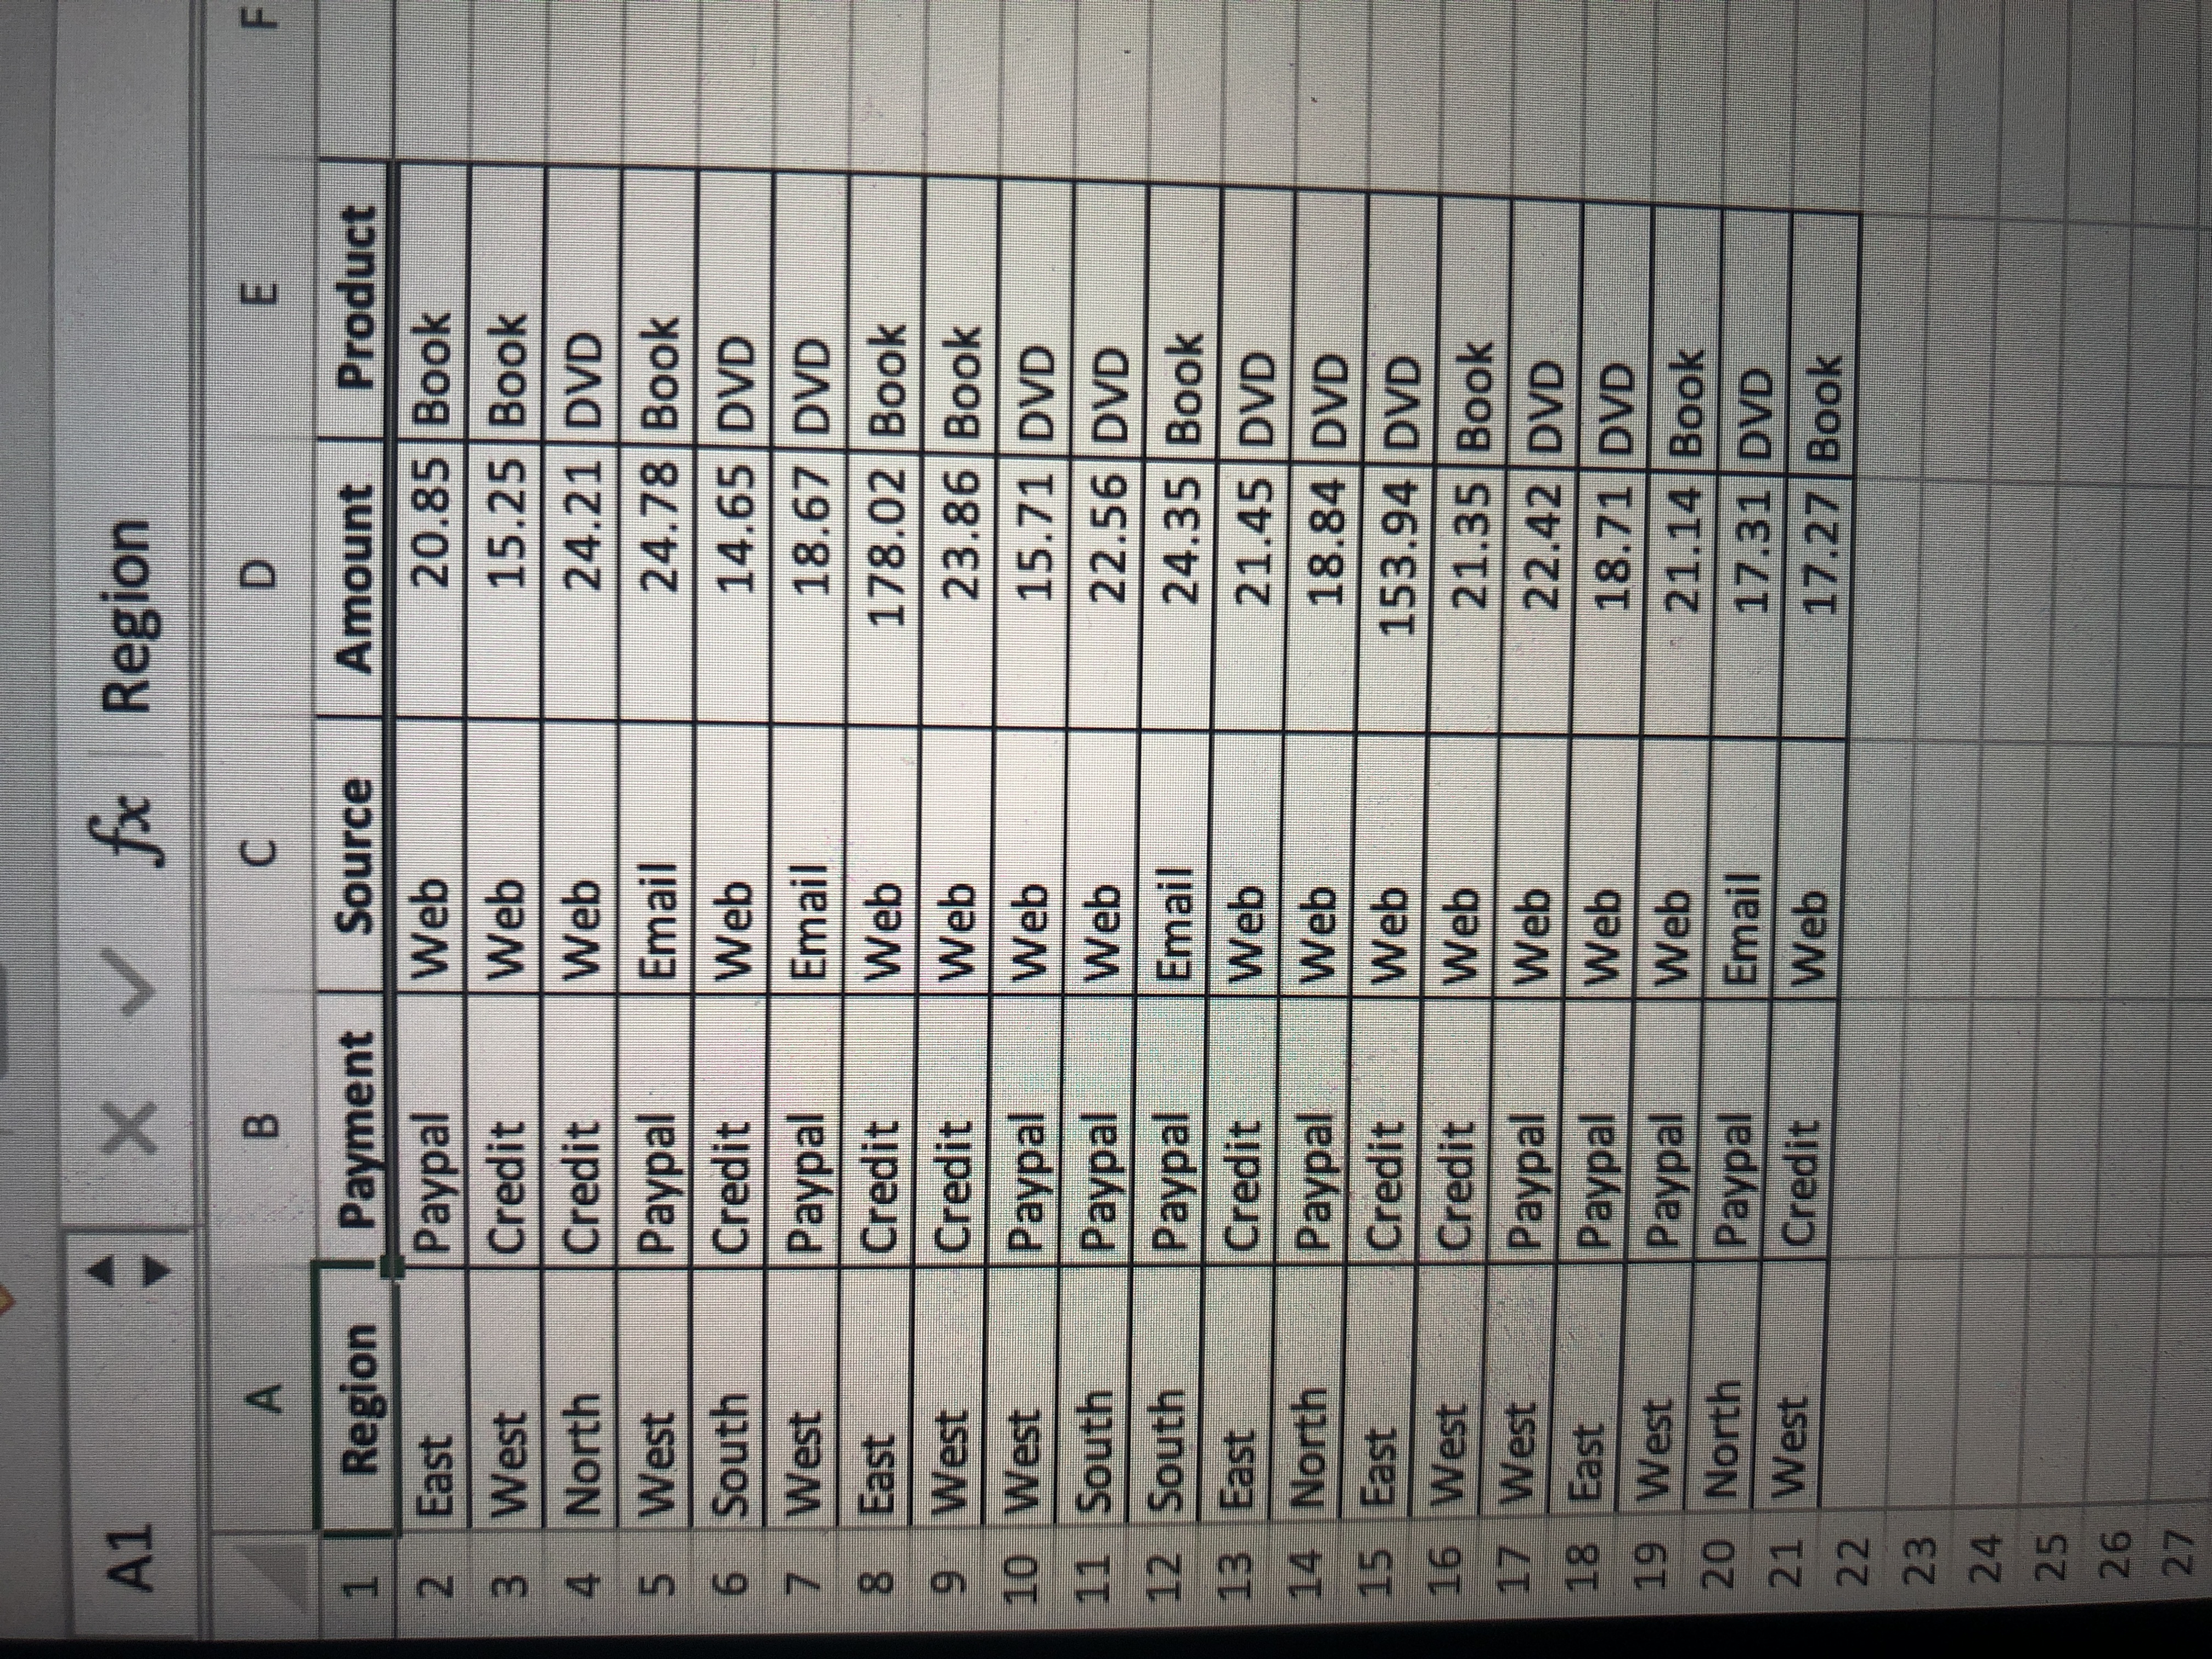

Transcribed Image Text:A1
^ x
fx Region
D.
Amount Product
20.85 Book
A
F.
B.
Source
1.
Region
2 East
Payment
Paypal
Web
3 West
Credit
Web
15.25 Book
4 North
Credit
Web
24.21 DVD
5West
Paypal
Email
24.78 Book
6 South
Credit
Web
14.65 DVD
7 West
Paypal
Email
18.67 DVD
8 East
Credit
Web
178.02 Book
9 West
Credit
Web
23.86 Book
10 West
Paypal
Web
| 15.71 DVD
11 South
Web
22.56 DVD
12 South
Paypal
Email
24.35 Book
13 East
Credit
Web
21.45 DVD
14 North
Paypal
Web
18.84 DVD
15 East
Credit
Web
153.94 DVD
16 West
Credit
Web
| 21.35 Book
17 West
Paypal
Paypal
Paypal
Paypal
Credit Web
Web
22.42 DVD
18 East
Web
18.71 DVD
19 West
Web
21.14 Book
20 North
Email
17.31 DVD
21 West
17.27 Book
22
23
24
25
27
Expert Solution
This question has been solved!
Explore an expertly crafted, step-by-step solution for a thorough understanding of key concepts.

This is a popular solution

Trending nowThis is a popular solution!

Step by stepSolved in 4 steps

Knowledge Booster

Similar questions
- A number of tools can be used in business process improvement. Of them a __________ is a type of chart that contains both bars and a line graph, where individual values are represented in descending order by bars, and the cumulative total is represented by the line.arrow_forwardA congressperson wants to come up with a single value to describe the prices of homes in their district. However, their district consists of a few homes that are extremely expensive compared to the others. Which descriptive statistic should they use? a. Range b. Mode c. Median d. Meanarrow_forwardUse the following cell phone airport data speeds (Mbps) from a particular network. Find Qg. 0.1 0.1 0.2 0.2 0.3 0.4 0.4 0.5 0.50 0.5 0.5 P 06 0.7 0.8 0.8 0.9 1.1 1.2 1.2 1.5 1.6 1.6 2.2 2.3 2.4 2.5 2.8 2.9 3.1 3.7 3.9 4.1 4.3 5.8 7.4 8.1 8.3 8.3 9.1 11.7 11.8 13.4 13.7 14.7 14.7 14.9 15.2 15.2 15.4 15.8 27.9 Q3 (Type an integer or a decimal. Do not round.) Mbpsarrow_forward
- The following bar graph shows the per capita personal incomes for six states in 2003. Use this bar graph to answer the quèstions. Per Capita Personal Income by State for 2003 39815 40,000 32810 32,000 - 30446 30913 29442 29234 24,000 - 16,000 - 8000 Georgia Florida Delaware Massachusetts Hawaii South Dakota State Step 1 of 2: Find the lowest per capita personal income for the six states shown. Answer 画 Tables 国 Keypad How to enter your answer Keyboard Shortcuts Submit Answer © 2021 Hawkes Learning Income (in Dollars)arrow_forwardUse the following cell phone airport data speeds (Mbps) from a particular network. Find P75. 0.2 0.2 0.3 0.3 0.3 0.3 0.3 0.4 0.5 0.5 O 0.5 0.6 0.7 0.8 0.9 1.2 1.3 1.5 1.7 1.7 1.7 2.2 2.3 2.5 2.7 2.9 3.4 3.4 3.8 4.6 5.6 5.8 7.1 8.5 9.7 10.8 11.1 11.9 12.2 12.6 12.7 12.9 13.3 13.8 14.1 14.8 15.3 15.9 15.9 29.3 P75 Mbps %3D (Type an integer or a decimal. Do not round.)arrow_forwardA small-appliance merchant shows an inventory of 120 Microwave Ovens at a cost of $79.80 and a market value of $79.40. Compute the inventory value at the lower of cost or market. $9,576 $9,528 $9,508 O $9,552arrow_forward
- Many countries, especially those in Europe, have significant gold holdings. But many of these countries also have massive debts. The following data show the total value of gold holdings in billions of U.S. dollars and the debt as a percentage of the gross domestic product for nine countries (WordPress and Trading Economics websites, February 24, 2012). Click on the datafile logo to reference the data. Country Gold Value Debt China 63 17.7 France 146 81.7 Germany 203 83.2 Indonesia 33 69.2 Italy 147 119 Netherlands 36 63.7 Russia 50 9.9 Switzerland 62 55 U.S. 487 93.2 Using the entire data set, develop the estimated regression equation that can be used to predict the debt of a country given the total value of its gold holdings. y^ = (to 4 decimals) (to 4 decimals) Gold Value Suppose that after looking at the scatter diagram in part (a) that you were able to visually identify what appears to be an…arrow_forwardThe following sales forecast was generated in Excel. What is line C? Sales Revenue $250,000 $200,000 $150,000 $100,000 $50,000 $0 1 wwwww 3 5 Multiple Choice 7 Sales Revenue пик -Forecast( Sales Revenue) Most likely predicted level of sales revenue 9 11 13 15 17 19 21 23 25 27 29 31 33 35 37 39 41 43 45 Highest predicted level of sales revenue Actual sales revenue Lowest predicted level of sales revenue A B Carrow_forwardUse the following cell phone airport data speeds (Mbps) from a particular network. Find P80. 0.3 0.3 0.4 0.5 0.5 0.5 0.7 0.7 0.7 0.7 O 0.8 0.8 0.9 0.9 0.9 0.9 0.9 0.9 1.3 1.4 1.5 1.8 1.9 2.2 2.2 2.5 2.6 2.6 2.9 3.3 3.4 4.6 4.7 5.2 5.8 6.5 7.1 7.1 7.4 7.8 8.8 10.9 12.4 12.6 12.6 13.6 13.8 14.2 14.3 26.2 P80 = Mbps (Type an integer or a decimal. Do not round.) Enter your answer in the answer box and then click Check Answer. All parts showing Clear All Check Answerarrow_forward
- Use the following cell phone airport data speeds (Mbps) from a particular network. Find Q₁. 0.1 0.3 0.5 0.5 0.6 0.9 1.1 1.3 1.7 2.6 2.8 2.9 3.9 7.4 8.5 8.6 12.1 14.4 15.6 15.7 0.2 0.7 2.3 4.1 13.3 0.2 0.9 2.4 5.4 13.6 0.2 0.9 2.5 5.5 13.7 Q₁ = Mbps (Type an integer or a decimal. Do not round.) 0.4 1.1 2.7 8.4 15.3 0.5 1.5 3.7 8.6 15.7 6685 0.6 1.6 3.8 ܣ 9.5 25.6arrow_forwardUse z scores to compare the given values. Based on sample data, newborn males have weights with a mean of 3224.6 g and a standard deviation of 739.9 g. Newborn females have weights with a mean of 3027.5 g and a standard deviation of 473.6 g. Who has the weight that is more extreme relative to the group from which they came: a male who weighs 1700 g or a female who weighs 1700 g? Since the z score for the male is z= and the z score for the female is z= the has the weight that is more extreme. (Round to two decimal places.)arrow_forwardUse the following cell phone airport data speeds (Mbps) from a particular network. Find P70- 0.6 먼 0.4 0.5 0.5 0.4 0.7 0.3 0.4 1.4 0.1 0.2 0.2 1.2 1.3 1.4 0.7 0.6 0.6 0.7 3.7 4.5 4.6 0.6 2.8 2.8 3.2 1.9 2.1 2.3 2.3 10.1 10.5 10.7 11.1 5.3 5.8 6.6 6.8 25.2 4.9 4.9 14.4 15.4 15.8 13.3 13.5 13.5 11.3 11.7 12.6 Mbps P70 = (Type an integer or a decimal. Do not round.) %3Darrow_forward
arrow_back_ios
arrow_forward_ios
Recommended textbooks for you
- MATLAB: An Introduction with ApplicationsStatisticsISBN:9781119256830Author:Amos GilatPublisher:John Wiley & Sons Inc
 Probability and Statistics for Engineering and th...StatisticsISBN:9781305251809Author:Jay L. DevorePublisher:Cengage Learning
 Statistics for The Behavioral Sciences (MindTap C...StatisticsISBN:9781305504912Author:Frederick J Gravetter, Larry B. WallnauPublisher:Cengage Learning
  Elementary Statistics: Picturing the World (7th E...StatisticsISBN:9780134683416Author:Ron Larson, Betsy FarberPublisher:PEARSON
 The Basic Practice of StatisticsStatisticsISBN:9781319042578Author:David S. Moore, William I. Notz, Michael A. FlignerPublisher:W. H. Freeman
 Introduction to the Practice of StatisticsStatisticsISBN:9781319013387Author:David S. Moore, George P. McCabe, Bruce A. CraigPublisher:W. H. Freeman
MATLAB: An Introduction with Applications
Statistics
ISBN:9781119256830
Author:Amos Gilat
Publisher:John Wiley & Sons Inc
Probability and Statistics for Engineering and th...
Statistics
ISBN:9781305251809
Author:Jay L. Devore
Publisher:Cengage Learning
Statistics for The Behavioral Sciences (MindTap C...
Statistics
ISBN:9781305504912
Author:Frederick J Gravetter, Larry B. Wallnau
Publisher:Cengage Learning
Elementary Statistics: Picturing the World (7th E...
Statistics
ISBN:9780134683416
Author:Ron Larson, Betsy Farber
Publisher:PEARSON
The Basic Practice of Statistics
Statistics
ISBN:9781319042578
Author:David S. Moore, William I. Notz, Michael A. Fligner
Publisher:W. H. Freeman
Introduction to the Practice of Statistics
Statistics
ISBN:9781319013387
Author:David S. Moore, George P. McCabe, Bruce A. Craig
Publisher:W. H. Freeman