
MATLAB: An Introduction with Applications
6th Edition
ISBN: 9781119256830
Author: Amos Gilat
Publisher: John Wiley & Sons Inc
expand_more
expand_more
format_list_bulleted
Related questions
Concept explainers
Question
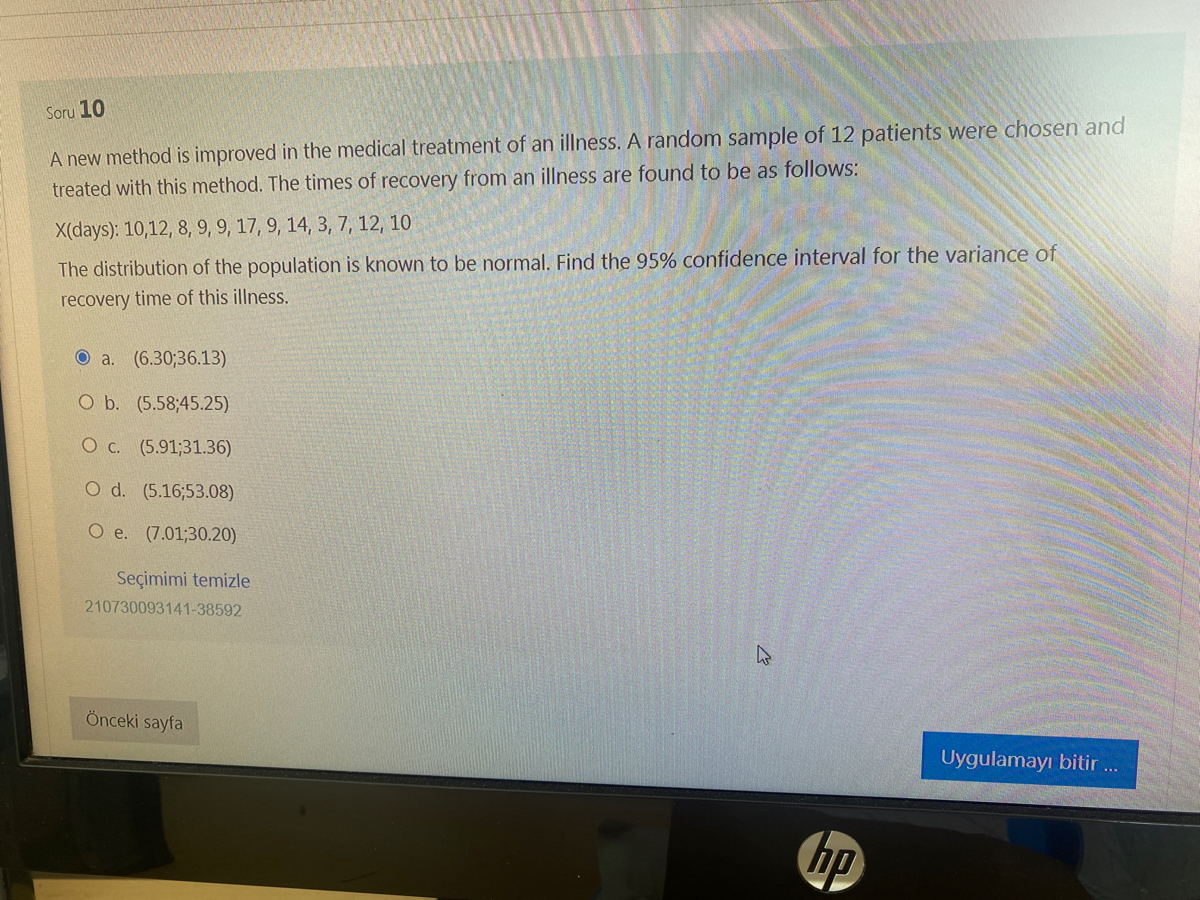

Transcribed Image Text:Soru 10
A new method is improved in the medical treatment of an illness. A random sample of 12 patients were chosen and
treated with this method. The times of recovery from an illness are found to be as follows:
X(days): 10,12, 8, 9, 9, 17, 9, 14, 3, 7, 12, 10
The distribution of the population is known to be normal. Find the 95% confidence interval for the variance of
recovery time of this illness.
O a. (6.30;36.13)
O b. (5.58;45.25)
O c. (5.91;31.36)
O d. (5.16;53.08)
O e. (7.01;30.20)
Seçimimi temizle
210730093141-38592
Önceki sayfa
Uygulamayı bitir
hp
Expert Solution
This question has been solved!
Explore an expertly crafted, step-by-step solution for a thorough understanding of key concepts.

Step by stepSolved in 2 steps with 2 images

Knowledge Booster


Learn more about
Need a deep-dive on the concept behind this application? Look no further. Learn more about this topic, statistics and related others by exploring similar questions and additional content below.Similar questions
- Suppose that we are interested in comparing the academic success of college students who belong to fraternal organizations and the academic success of those who do not belong to fraternal organizations. Random samples of size 40 are taken from each population where the variances and standard deviations are known. Sample Size Mean GPA Variance (2) 2.03 2.21 Fraternity member (f): 40 Nonmembers (n): 40 .46 .35 Construct a 96% confidence interval estimate for the difference between the mean GPAS (uf- un). Interpret this interval estimate. What can you conclude about the mean GPAs of the two groups?arrow_forwardDo a two-sample test for equality of means assuming unequal variances. Calculate the p-value using Excel. (a-1) Comparison of GPA for randomly chosen college juniors and seniors: x⎯⎯1x¯1 = 4.5, s1 = .20, n1 = 15, x⎯⎯2x¯2 = 4.9, s2 = .30, n2 = 15, α = .025, left-tailed test.(Negative values should be indicated by a minus sign. Round down your d.f. answer to the nearest whole number and other answers to 4 decimal places. Do not use "quick" rules for degrees of freedom.) d.f. Not attempted t-calculated Not attempted p-value Not attempted t-critical Not attempted (a-2) Based on the above data choose the correct decision. Do not reject the null hypothesis Reject the null hypothesisarrow_forwardThe results of a state mathematics test for random samples of students taught by two different teachers at the same school are shown below. Can you conclude there is a difference in the mean mathematics test scores for the students of the two teachers? Use α = 0.01. In addition, assume the populations are normally distributed and the population variances/standard deviations are not equal. Teacher 1 Teacher 2 ?̅1 = 473 ?̅2 = 459 S1 = 39.7 S2 = 24.5 n 1 = 8 n 2 = 18 a. State the null and alternate hypotheses (write it mathematically) and write your claim. b. Find the test statistic c. Identify the Rejection region (critical region) and fail to reject region. Show this by drawing a curve and…arrow_forward
- You are testing the claim that having lights on at night increases weight gain (abstract). A sample of 10 mice lived in an environment with bright light on all of the time and 8 mice who lived in an environment with a normal light/dark cycle is given below. Test the claim using a 10% level of significance. Assume the population variances are unequal and that the weight changes are normally distributed. Give answers to 3 decimal places. Data available at StatKey, choose Mice Wgt Gain-2e data set Light (x₁) 1.71 4.67 4.99 5.33 5.43 6.94 7.15 9.17 10.26 11.67 What are the correct hypotheses? Note this may view better in full screen mode. Select the correct symbols in the order they appear in the problem. Ho: Select an answer ? V Select an answer V Ha: Select an answer ✓ Based on the hypotheses, find the following: Test Statistic = Dark (₂) 2.27 2.53 2.83 4 4.21 4.6 5.95 6.52 p-value = ? V Select an answer V (Hint: difference in means from Ha) The correct decision is to Select an answer…arrow_forwardPlease help! I need this to graduate, thank you so much.arrow_forwardA behavioral researcher measures the stress response of mice exposed to scary animal pictures (cat, dog, lion, Cheshire cat) with a GABA sensor implanted in the brain. He uses randomly assigned 40 mice, 10 in each group. The researcher records the amount of stress after 30 seconds assuming that there is no difference in the response in whatever way the mouse is scared. The data is normally distributed. Means and variances are provided in the table below. Is there a difference in the response to scary animals. Group 1 - Cat n₁=10 m₁ = 10 s² 1= 1.8 Group 2 - Dog n2=10 m₂= 5.0 s²2= 3.4 Why is the scare effect so low in group 4? Group 3 - Lion n3=10 m3= 3.4 s²1= 2.5 Group 4 - Chesire Cat n4=10 m4= 2.4 s² 1= 1.6arrow_forward
- A researcher decides to measure anxiety in group of bullies and a group of bystanders using a 23-item, 3 point anxiety scale. Assume scores on the anxiety scales are normally distributed and the variance among the group of bullies and bystanders are the same. A group of 30 bullies scores an average of 21.5 with a sample standard deviation of 10 on the anxiety scale. A group of 27 bystanders scored an average of 25.8 with a sample standard deviation of 8 on the anxiety scale. You do not have any presupposed assumptions whether bullies or bystanders will be more anxious so you formulate the null and alternative hypothesis based on that.arrow_forwardA researcher wants to measure average cardiovascular health of university students and compare those scores to the average scores in the general population. Assuming that population variance is known, what statistical test is most appropriate for this study? independent-samples t-test single-sample t-test z-test for sample mean related-samples t-testarrow_forwardIn a study performed on comfort food eating during times of stress, it was found that mean rated comfort food consumption level (on a scale from 1-20) for a group of students undertaking their exam period was 14. In comparison, a group of students who were not undertaking exams or examination preparation had a mean rated comfort food consumption level of 10. The pooled estimate of the population variance was 64. What is the estimated effect size (d) of the study? 0.80 0.06 0.50 2.00arrow_forward
arrow_back_ios
arrow_forward_ios
Recommended textbooks for you
- MATLAB: An Introduction with ApplicationsStatisticsISBN:9781119256830Author:Amos GilatPublisher:John Wiley & Sons Inc
 Probability and Statistics for Engineering and th...StatisticsISBN:9781305251809Author:Jay L. DevorePublisher:Cengage Learning
 Statistics for The Behavioral Sciences (MindTap C...StatisticsISBN:9781305504912Author:Frederick J Gravetter, Larry B. WallnauPublisher:Cengage Learning
  Elementary Statistics: Picturing the World (7th E...StatisticsISBN:9780134683416Author:Ron Larson, Betsy FarberPublisher:PEARSON
 The Basic Practice of StatisticsStatisticsISBN:9781319042578Author:David S. Moore, William I. Notz, Michael A. FlignerPublisher:W. H. Freeman
 Introduction to the Practice of StatisticsStatisticsISBN:9781319013387Author:David S. Moore, George P. McCabe, Bruce A. CraigPublisher:W. H. Freeman
MATLAB: An Introduction with Applications
Statistics
ISBN:9781119256830
Author:Amos Gilat
Publisher:John Wiley & Sons Inc
Probability and Statistics for Engineering and th...
Statistics
ISBN:9781305251809
Author:Jay L. Devore
Publisher:Cengage Learning
Statistics for The Behavioral Sciences (MindTap C...
Statistics
ISBN:9781305504912
Author:Frederick J Gravetter, Larry B. Wallnau
Publisher:Cengage Learning
Elementary Statistics: Picturing the World (7th E...
Statistics
ISBN:9780134683416
Author:Ron Larson, Betsy Farber
Publisher:PEARSON
The Basic Practice of Statistics
Statistics
ISBN:9781319042578
Author:David S. Moore, William I. Notz, Michael A. Fligner
Publisher:W. H. Freeman
Introduction to the Practice of Statistics
Statistics
ISBN:9781319013387
Author:David S. Moore, George P. McCabe, Bruce A. Craig
Publisher:W. H. Freeman