MATLAB: An Introduction with Applications
6th Edition
ISBN: 9781119256830
Author: Amos Gilat
Publisher: John Wiley & Sons Inc
expand_more
expand_more
format_list_bulleted
Question

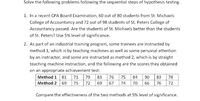
Transcribed Image Text:Solve the following problems following the sequential steps of hypothesis testing.
1. In a recent CPA Board Examination, 60 out of 80 students from St. Michaels
College of Accountancy and 72 out of 98 students of St. Peters College of
Accountancy passed. Are the students of St. Michaels better than the students
of St. Peters? Use 5% level of significance.
2. As part of an industrial training program, some trainees are instructed by
method 1, which is by teaching machines as well as some personal attention
by an instructor, and some are instructed as method 2, which is by straight
teaching machine instruction, and the following are the scores they obtained
on an appropriate achievement test:
Method 1
81
71
79
83
76
75
84
90
83
78
Method 2
69
75
72
69
67
74
70
66
76
72
Compare the effectiveness of the two methods at 5% level of significance.
Expert Solution
This question has been solved!
Explore an expertly crafted, step-by-step solution for a thorough understanding of key concepts.
Step by stepSolved in 3 steps with 3 images

Knowledge Booster
Similar questions
- The Bureau of Labor Statistics reports that the official unemployment rate for Black people was 10.4% and 4.7% for White people in February 2015. Select all correct answers for this question. O The samples of white and black people are independent. The explanatory variable is the unemployment rate. The response variable is the unemployment rate. The response variable is race.arrow_forwardIn the Texas senate races, a candidate must clear 50% to avoid a runoff election. In a recent poll of 1040 voters in Texas, 51% of voters preferred candidate. We will a hypothesis test to see if we can say at the 5% significance level that more than 50% of voters in Texas prefer candidate based on this poll. State the null and alternative hypothesis. Find the test-statistic. Find the P-value. Make a conclusion. Interpret your answer.arrow_forwardA De Anza student decided to determine whether the percent of men who participate in sports at De Anza College is higher than the percent of women who participate in sports at De Anza College. Out of 67 women, 12 said they participate in sports. 13 of the 45 men surveyed said they participate in sports. a. ) What are the type I and type II errors? Explain them in the context of this problem.b. ) Describe the sample statistics in words. What is the distribution of the sample statistic? Explain why you used this distribution.Can someone please help me make sense of these questions?arrow_forward
- Using 1% for the significance level, find the conclusion of this hypothesis testing in words using the p-value approach. Follow the questions below. 1) State the p-value and interpret the p-value in words. 2) Using the significance level and the p-value, state the conclusion of this hypothesis testing.arrow_forwardA curious student wants to see if she can conclude that a higherproportion of Woodland College students transfer to Sac State than Yuba College students. He samples 82 Woodland College students and finds that 23 of them transferred to Sac State. He also samples 95 Yuba college students and finds that 21 of them transferred to Sac State. What can be concluded at a 5% significance level? Use the pvalue approach.arrow_forwardSierra College students enrolled in an online Elementary Statistics course were asked to participate in an anonymous onlne survey. The survey asked the students "Which type of device will you primarily use to access your online course in Canvas?". Of the 152 students who answered this question, 20 responded "a desktop computer", 121 responded "a laptop computer", 6 responded "a smartphone", and 5 responded "a tablet". The Sierra College Mathematics Department believes that less than 5% of students enrolled in an online Elementary Statistics course primarily uses a smartphone to access their online course in Canvas. Use the data collected in the survey to conduct a hypothesis testing procedure to test this belief. What conclusion should be reached according to the results of this hypothesis test?arrow_forward
arrow_back_ios
arrow_forward_ios
Recommended textbooks for you
 MATLAB: An Introduction with ApplicationsStatisticsISBN:9781119256830Author:Amos GilatPublisher:John Wiley & Sons Inc
 Probability and Statistics for Engineering and th...StatisticsISBN:9781305251809Author:Jay L. DevorePublisher:Cengage Learning
 Statistics for The Behavioral Sciences (MindTap C...StatisticsISBN:9781305504912Author:Frederick J Gravetter, Larry B. WallnauPublisher:Cengage Learning
 Elementary Statistics: Picturing the World (7th E...StatisticsISBN:9780134683416Author:Ron Larson, Betsy FarberPublisher:PEARSON
 The Basic Practice of StatisticsStatisticsISBN:9781319042578Author:David S. Moore, William I. Notz, Michael A. FlignerPublisher:W. H. Freeman
 Introduction to the Practice of StatisticsStatisticsISBN:9781319013387Author:David S. Moore, George P. McCabe, Bruce A. CraigPublisher:W. H. Freeman

MATLAB: An Introduction with Applications
Statistics
ISBN:9781119256830
Author:Amos Gilat
Publisher:John Wiley & Sons Inc

Probability and Statistics for Engineering and th...
Statistics
ISBN:9781305251809
Author:Jay L. Devore
Publisher:Cengage Learning

Statistics for The Behavioral Sciences (MindTap C...
Statistics
ISBN:9781305504912
Author:Frederick J Gravetter, Larry B. Wallnau
Publisher:Cengage Learning

Elementary Statistics: Picturing the World (7th E...
Statistics
ISBN:9780134683416
Author:Ron Larson, Betsy Farber
Publisher:PEARSON

The Basic Practice of Statistics
Statistics
ISBN:9781319042578
Author:David S. Moore, William I. Notz, Michael A. Fligner
Publisher:W. H. Freeman

Introduction to the Practice of Statistics
Statistics
ISBN:9781319013387
Author:David S. Moore, George P. McCabe, Bruce A. Craig
Publisher:W. H. Freeman