MATLAB: An Introduction with Applications
6th Edition
ISBN: 9781119256830
Author: Amos Gilat
Publisher: John Wiley & Sons Inc
expand_more
expand_more
format_list_bulleted
Question

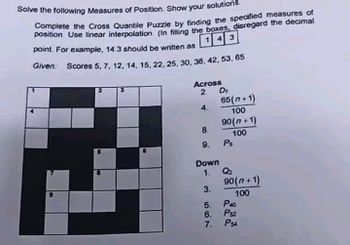
Transcribed Image Text:Solve the following Measures of Position. Show your solutions.
Complete the Cross Quantile Puzzle by finding the specified measures of
position Use linear interpolation (In filling the boxes, disregard the decimal
point. For example, 14.3 should be written as
143
Given: Scores 5, 7, 12, 14, 15, 22, 25, 30, 36, 42, 53, 65
Across
2
4.
8
9.
Down
1.
3.
5.
6.
7.
D₁
65(n+1)
100
90(n+1)
100
P9
Q₂
90(n+1)
100
P40
PS2
PS4
Expert Solution
This question has been solved!
Explore an expertly crafted, step-by-step solution for a thorough understanding of key concepts.
This is a popular solution
Trending nowThis is a popular solution!
Step by stepSolved in 4 steps with 3 images

Knowledge Booster
Similar questions
- Find the indicated z-scores shown in the graph. Click to view page 1 of the table. Click to view page 2 of the table. The z-scores are (Use a comma to separate answers as needed. Round to two decimal places as needed.) C Az 0.0294 Z=? 0 Z=? 0.0294arrow_forwardCalculate each value requested for the following set of scoresarrow_forwardYou will simulate shooting basketball free throws. Using any coin, let heads represent the ball going into the basket and tales represent the ball missing the basket. Each toss of the coin represents a shot at the free throw line. Simulate shooting 35 free throws. Make a chart on your paper similar to the one below to record your results. For each trial (toss), place an x in the appropriate column. Toss number 1 2 Went in (Heads) X Questions: 1. How many free throws went into the basket? 2. How many free throws missed the basket? Missed (Tails) X 3. What is the experimental probability that you will make the next free throw? 4. What is the experimental probability that you will miss the next free throw? 5. This simulation assumes that you have an equal chance of making the free throw or missing the free throw. Is this a correct assumption? Why? 6. How would you change this simulation to better predict a person's abilities at making free throws?arrow_forward
- Match these values of r with the accompanying scatterplots: - 0.385, 0.385, 0.997, - 0.767, and 1. Click the icon to view the scatterplots. Match the values of r to the scatterplots. Scatterplots Scatterplot 1, r = 0.385 Scatterplot 2, r= 0.997 Scatterplot 3, r = -0.767 Scatterplot 4, r = Scatterplot 1 Scatterplot 2 Scatterpl 8- R- 8- - 0.385 6- 6- 6- Scatterplot 5, r= 1 > 4- 4- 4- 2- 2- b- 0- 0- 0.2 0.4 0.6 0.8 1 0.2 0.4 0.6 0.8 1 0.2 0.4 0.6 х х Scatterplot 4 Scatterplot 5 15- 8- 14- 6- 13- 4- 12- 2- 11- 10- 0+ 1 0.2 0.4 0.6 0.8 0.2 0.4 0.6 0.8 хarrow_forwardCan you please help me figure out the Z and P value. I can do the multiple choice on my own. Also, if you can please make it clear what the answers are that would be great often things are left vauge and I dont know which is the answer. Thank you for your help.arrow_forwardPlease help me solve the following question, explain it and pls pls make sure everything is correct 10000% thank you !arrow_forward
- Brooke’s current grades in Geometry are the following. Is it possible for Brooke to earn a B (80%) in the class after he takes the EOC? Show your work and explain your answer. Brooke’s grades: Grading System: Tests: 76, 71, 68, 73, 77 Quizzes: 66, 70, 71, 65, 70 Daily Work: 71% EOC: ? Tests: 40% Quizzes: 25% Daily Work: 15% EOC: 20%arrow_forwardMatch these values of r with the accompanying scatterplots: 0.465, - 0.465, - 0.797, 1, and 0.797. Click the icon to view the scatterplots. Match the values of r to the scatterplots. Scatterplot 1, r= Scatterplots Scatterplot 2, r= Scatterplot 3, r= Scatterplot 4, r Scatterplot 1 Scatterplot 2 Scat Scatterplot 5, r= 8- 15- 14- 6- 6- 13- >4. 12 2- 2- 11- O 02 04 o's o8 i 04 6 02 04 os o'8 10 0.2 o4 Satterplot 4 Scatterplot 5 8- 6- >4. 2- 6 02 o4 o's o's 04 o o2 04 o's o's Print Done of ofarrow_forward
arrow_back_ios
arrow_forward_ios
Recommended textbooks for you
 MATLAB: An Introduction with ApplicationsStatisticsISBN:9781119256830Author:Amos GilatPublisher:John Wiley & Sons Inc
 Probability and Statistics for Engineering and th...StatisticsISBN:9781305251809Author:Jay L. DevorePublisher:Cengage Learning
 Statistics for The Behavioral Sciences (MindTap C...StatisticsISBN:9781305504912Author:Frederick J Gravetter, Larry B. WallnauPublisher:Cengage Learning
 Elementary Statistics: Picturing the World (7th E...StatisticsISBN:9780134683416Author:Ron Larson, Betsy FarberPublisher:PEARSON
 The Basic Practice of StatisticsStatisticsISBN:9781319042578Author:David S. Moore, William I. Notz, Michael A. FlignerPublisher:W. H. Freeman
 Introduction to the Practice of StatisticsStatisticsISBN:9781319013387Author:David S. Moore, George P. McCabe, Bruce A. CraigPublisher:W. H. Freeman

MATLAB: An Introduction with Applications
Statistics
ISBN:9781119256830
Author:Amos Gilat
Publisher:John Wiley & Sons Inc

Probability and Statistics for Engineering and th...
Statistics
ISBN:9781305251809
Author:Jay L. Devore
Publisher:Cengage Learning

Statistics for The Behavioral Sciences (MindTap C...
Statistics
ISBN:9781305504912
Author:Frederick J Gravetter, Larry B. Wallnau
Publisher:Cengage Learning

Elementary Statistics: Picturing the World (7th E...
Statistics
ISBN:9780134683416
Author:Ron Larson, Betsy Farber
Publisher:PEARSON

The Basic Practice of Statistics
Statistics
ISBN:9781319042578
Author:David S. Moore, William I. Notz, Michael A. Fligner
Publisher:W. H. Freeman

Introduction to the Practice of Statistics
Statistics
ISBN:9781319013387
Author:David S. Moore, George P. McCabe, Bruce A. Craig
Publisher:W. H. Freeman