
MATLAB: An Introduction with Applications
6th Edition
ISBN: 9781119256830
Author: Amos Gilat
Publisher: John Wiley & Sons Inc
expand_more
expand_more
format_list_bulleted
Related questions
Concept explainers
Question
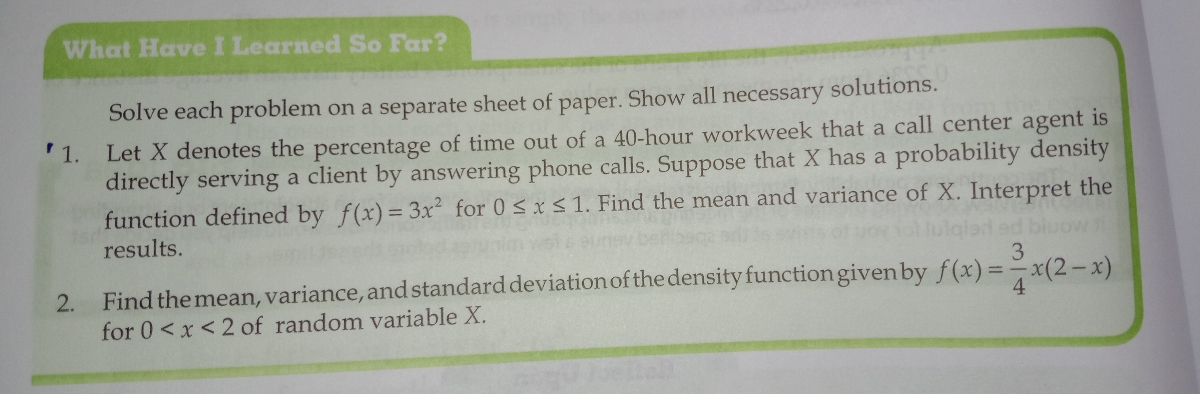

Transcribed Image Text:What Have I Learned So Far?
Solve each problem on a separate sheet of paper. Show all necessary solutions.
Let X denotes the percentage of time out of a 40-hour workweek that a call center agent is
directly serving a client by answering phone calls. Suppose that X has a probability density
function defined by f(x)= 3x2 for 0 < xS1. Find the mean and variance of X. Interpret the
'1.
results.
od ed bluovw
3
Find the mean, variance, and standard deviation of the density functiongiven by f(x)=-
for 0<x<2 of random variable X.
x(2-x)
2.

Transcribed Image Text:What HaveI Learned So Far?
paper.
Answer the following questions on a separate sheet of
1. Determine if each of the following situations illustrates a continuous random variable or not
a. weight of a randomly selected grade 11 student
b. number of Filipino people who will vote in the next national election
fastest speed of a randomly selected car racer in a car racing competition
d. a farmer's record of the number of mongo seeds in a sack
C.
2. Let X be a continuous variable with probability density function f(x) = cx defined for 0sxS1,
where c is constant. Find c.
3.
Let X be a continuous random variable whose probability density function is defined by
3.
f(x) = -x(2-x) for 0 <x< 2. Find P
Let X be a continuous random variable whose probability density function is f(x)=1-|x| for
-1 <x<1. The triangular distribution of f is shown below.
4.
diwsideihs ob
vilidn
0.5
-0.5
0.5
sebl pi
nl a. Explain why fis a probability density function?
b. Find P(0<x <1).
c Compute P*<1).
C.
<x<
Compute P( -<<
d.
Expert Solution
This question has been solved!
Explore an expertly crafted, step-by-step solution for a thorough understanding of key concepts.

This is a popular solution

Trending nowThis is a popular solution!

Step by stepSolved in 3 steps

Knowledge Booster


Learn more about
Need a deep-dive on the concept behind this application? Look no further. Learn more about this topic, statistics and related others by exploring similar questions and additional content below.Similar questions
- Please see picturearrow_forward1. or a cumulative distribution funetion (cdf). Decide if the function graphed below is a probability density function (pdf) 2c 4 8.arrow_forwardVerify that the function corresponding to the following figure is a valid probability density function. Then find the following probabilities:arrow_forward
- What is the correct response to this question? Thanks.arrow_forwardthe driving time from toronto to montreal are uniformly distributed with times ranging from four hours to 5.75 hours. draw a probability density graph that shows this (be sure to fully label your graph).arrow_forwardStudents arrive at a lecture theatre independently. Suppose the number of students arriving in an hour follows a Poisson distribution with mean 10. Let 7 (in hours) be the time required to wait for 5 students to arrive. Derive the probability density function of T.arrow_forward
- Suppose a college professor never finishes her lecture before the end of the class period, and always finishes within five minutes after the class period is supposed to end. Let X = time that elapses between the end of the class period and the actual end of the lecture. Suppose the pdf of X is: (image) Find the value of k that makes f(x) a legitimate probability density function, and use that value of k to find the probability that the lecture ends less than 3 minutes after the class period is supposed to end.arrow_forwardLet X be a random variable that follows the beta distribution. This random variable is continuous and is defined over the interval from 0 to 1. The probability density function is given by whereand are integers, whose values determine the shape of the probability density function. Because X varies between 0 and 1, we can think of X as the probability that some event (say) E occurs or the proportion of times an event occurs in some population. For example, E could denote the event that a critical part in a newly designed car will lead to a catastrophic failure in accidents at high speeds. The expected value (i.e., mean) of this random variable is []. That is, . The Excel commands for the beta random variable are =beta.dist(x,,,true,0,1) for the cumulative probability distribution, and =beta.dist(x,,,false,0,1) for the probability density function. (a) Now, think in Bayesian terms.…arrow_forward
arrow_back_ios
arrow_forward_ios
Recommended textbooks for you
- MATLAB: An Introduction with ApplicationsStatisticsISBN:9781119256830Author:Amos GilatPublisher:John Wiley & Sons Inc
 Probability and Statistics for Engineering and th...StatisticsISBN:9781305251809Author:Jay L. DevorePublisher:Cengage Learning
 Statistics for The Behavioral Sciences (MindTap C...StatisticsISBN:9781305504912Author:Frederick J Gravetter, Larry B. WallnauPublisher:Cengage Learning
  Elementary Statistics: Picturing the World (7th E...StatisticsISBN:9780134683416Author:Ron Larson, Betsy FarberPublisher:PEARSON
 The Basic Practice of StatisticsStatisticsISBN:9781319042578Author:David S. Moore, William I. Notz, Michael A. FlignerPublisher:W. H. Freeman
 Introduction to the Practice of StatisticsStatisticsISBN:9781319013387Author:David S. Moore, George P. McCabe, Bruce A. CraigPublisher:W. H. Freeman
MATLAB: An Introduction with Applications
Statistics
ISBN:9781119256830
Author:Amos Gilat
Publisher:John Wiley & Sons Inc
Probability and Statistics for Engineering and th...
Statistics
ISBN:9781305251809
Author:Jay L. Devore
Publisher:Cengage Learning
Statistics for The Behavioral Sciences (MindTap C...
Statistics
ISBN:9781305504912
Author:Frederick J Gravetter, Larry B. Wallnau
Publisher:Cengage Learning
Elementary Statistics: Picturing the World (7th E...
Statistics
ISBN:9780134683416
Author:Ron Larson, Betsy Farber
Publisher:PEARSON
The Basic Practice of Statistics
Statistics
ISBN:9781319042578
Author:David S. Moore, William I. Notz, Michael A. Fligner
Publisher:W. H. Freeman
Introduction to the Practice of Statistics
Statistics
ISBN:9781319013387
Author:David S. Moore, George P. McCabe, Bruce A. Craig
Publisher:W. H. Freeman