
Related questions
Concept explainers
Solaris Pte Ltd is a manufacturer of solar panels used by many organisations in solar farms to
produce electricity in Singapore. The last few years had been tough. The COVID19 pandemic
had shutdown many economic activities leading to poor sales in solar panels. In more recent
times, with many countries in the world embracing endemic COVID and opening up their
borders, economic activities are restarting. The CEO of Solaris is optimistic even though there
are other challenges like sharp spikes in oil and gas prices, war in Ukraine and frequent supply
chain disruptions
| Table 4. Solar Panel Sales | |
| Period | Units Sold |
| Actual | |
| 2019 Q1 | 25000 |
| 2019 Q2 | 22500 |
| 2019 Q3 | 17500 |
| 2019 Q4 | 12500 |
| 2020 Q1 | 10500 |
| 2020 Q2 | 10750 |
| 2020 Q3 | 12500 |
| 2020 Q4 | 17500 |
| 2021 Q1 | 21250 |
| 2021 Q2 | 23750 |
| 2021 Q3 | 25000 |
| 2021 Q4 | 27500 |
| 2022 Q1 | 60825 |
| 2022 Q2 | 57500 |
| 2022 Q3 | ? |
| 2022 Q4 | ? |
| 2023 Q1 | ? |
| 2023 Q2 | ? |
Table 4 shows the past quarterly sales data of solar panels sold by Solaris in terms of units per
quarter for the last three years. Sales data are only available right up to the second quarter of
2022. The CEO would like its sales manager to
from 2022 Q3 to 2023 Q2.
Suppose you are the Sales Manager at Solaris. Using the Weighted Moving Average (WMA)
method, develop a quarterly sales forecast for the solar panels.
(i) What is your sales forecast for 2022Q3 through 2023Q2? You may assume that the weights
are 2:3:1 where weight 2 is for the oldest data point and weight 1 is for the most recent
data. What is the Mean Absolute Deviation (MAD) of your forecast? (Note: you need to
show how the first two (2) values of your WMA, Absolute Error and final MAD are
computed.)
(ii) Comment on your new forecasts in terms of its reliability for business planning.
(Hint: consider plotting a graph of your new forecast for analysis.)
Do provide all equations, tables, graphs and working
Do show all equations, workings, tables and graph.
The forecast values from 2022 Q3 to 2023Q2 can be calculated by using the concept of linear regression. Under this concept, there are certain variables that are dependent and independent in nature. One variable may be dependent on one or multiple independent variables. This concept helps in better prediction for business decisions and strategies. The regression is represented as . Here "x" may represent the period number and "y" be the number of units to be sold. The letter "m" represents the slope and "b" is the intercept.
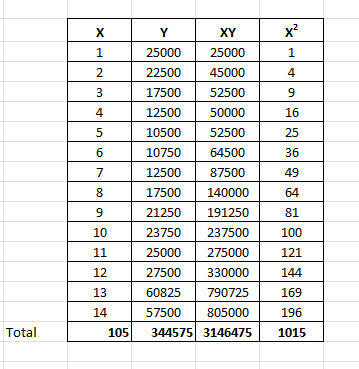
We have obtained the following information:

Step by stepSolved in 3 steps with 4 images


- According to the case study titled "Sibanye is Now the World's No. 1 Platinum Miner," published on May 30, 2019, by Felix Njini of Bloomberg,what are the distinctions between Corporate Social Investments and Corporate Social Responsibility, and a rationale for the strategy Sibanye should adopt to navigate the fluctuating macroeconomic landscape in South Africa.arrow_forwardWhat other policies should the United States government pursue to secure access to crucial medical goods during shocks like Covid-19?arrow_forwardSuppose that Norway is a small country and currently produces 100,000 board feet of lumber at $600 per 1,000 board feet. Then it begins to trade at the world price of $500 per 1,000 board feet. As a result of trade, Norway's production falls to 50,000 board feet and its consumption increases to 200,000 board feet. What is Norway's total welfare gain once it begins to trade? $5,000 $7,500 $17,500 $15,000arrow_forward
- What is the bunker surcharges how impact to oil prices?arrow_forward1.)According to Okun's law, if the unemployment rate goes from 10% to 8%, what will be the effect on the GDP? 2.)According to Okun's law, if the GDP goes down 1%, what has happened to the unemployment?arrow_forwardDo you think revisions to policy over compliance with national critical infrastructure security is warranted?arrow_forward
- Do drug companies have an obligation to make new drugs available to patients who were involved in their development, either here or overseas? Does the size of the company make a difference? What would you do if you were Dr. Lange? What obligations, ideals, and consequences should he take into account? Is it ethical for companies to decline to sell a useful drug like ranolazine in a poor country because they can make more money marketing it elsewhere?arrow_forwardLimit global warming. Global warming above 2°C will cause dangerous and irreversible impacts that will harm our prosperity, security, health, and lives. Limiting warming to less than 2°C is not without challenges either (we are already seeing impacts today), however it is a benchmark by which scientists and world leaders believe we can lower the risks to a more manageable level. Preserve and create a healthy economy. Your policies should strive to lead a global energy transition that would preserve and create a healthy global economy. You must decide how to balance the short-term costs of climate actions with the long-term costs of damages from climate inaction. Note that financial costs are not explicitly predicted in the model as they are uncertain and controversial. You may offer your own hypotheses on the financial impacts of different decisions. While assessing the economics, also consider the potential to offset short-term costs with additional co-benefits e.g., benefits to the…arrow_forwardPhilippine Economics What factors contributed to the failure of the Philippine industrialization during the 1950s and the 1960s, given the comparative progress of its neighboring countries? Why do you think it has not come to fruition until the present? Would you favor the promotion of Philippine industrialization during the present times? Why or why not? Which periods of Philippine economic history have seen significant jumps in inflation? What are the various hypotheses for the high inflation rates and what have been the results of such high inflation for the economy and the average Filipino?arrow_forward
- Practical Management ScienceOperations ManagementISBN:9781337406659Author:WINSTON, Wayne L.Publisher:Cengage,
 Operations ManagementOperations ManagementISBN:9781259667473Author:William J StevensonPublisher:McGraw-Hill Education
 Operations and Supply Chain Management (Mcgraw-hi...Operations ManagementISBN:9781259666100Author:F. Robert Jacobs, Richard B ChasePublisher:McGraw-Hill Education
 Purchasing and Supply Chain ManagementOperations ManagementISBN:9781285869681Author:Robert M. Monczka, Robert B. Handfield, Larry C. Giunipero, James L. PattersonPublisher:Cengage Learning
 Production and Operations Analysis, Seventh Editi...Operations ManagementISBN:9781478623069Author:Steven Nahmias, Tava Lennon OlsenPublisher:Waveland Press, Inc.