
FINANCIAL ACCOUNTING
10th Edition
ISBN: 9781259964947
Author: Libby
Publisher: MCG
expand_more
expand_more
format_list_bulleted
Related questions
Question
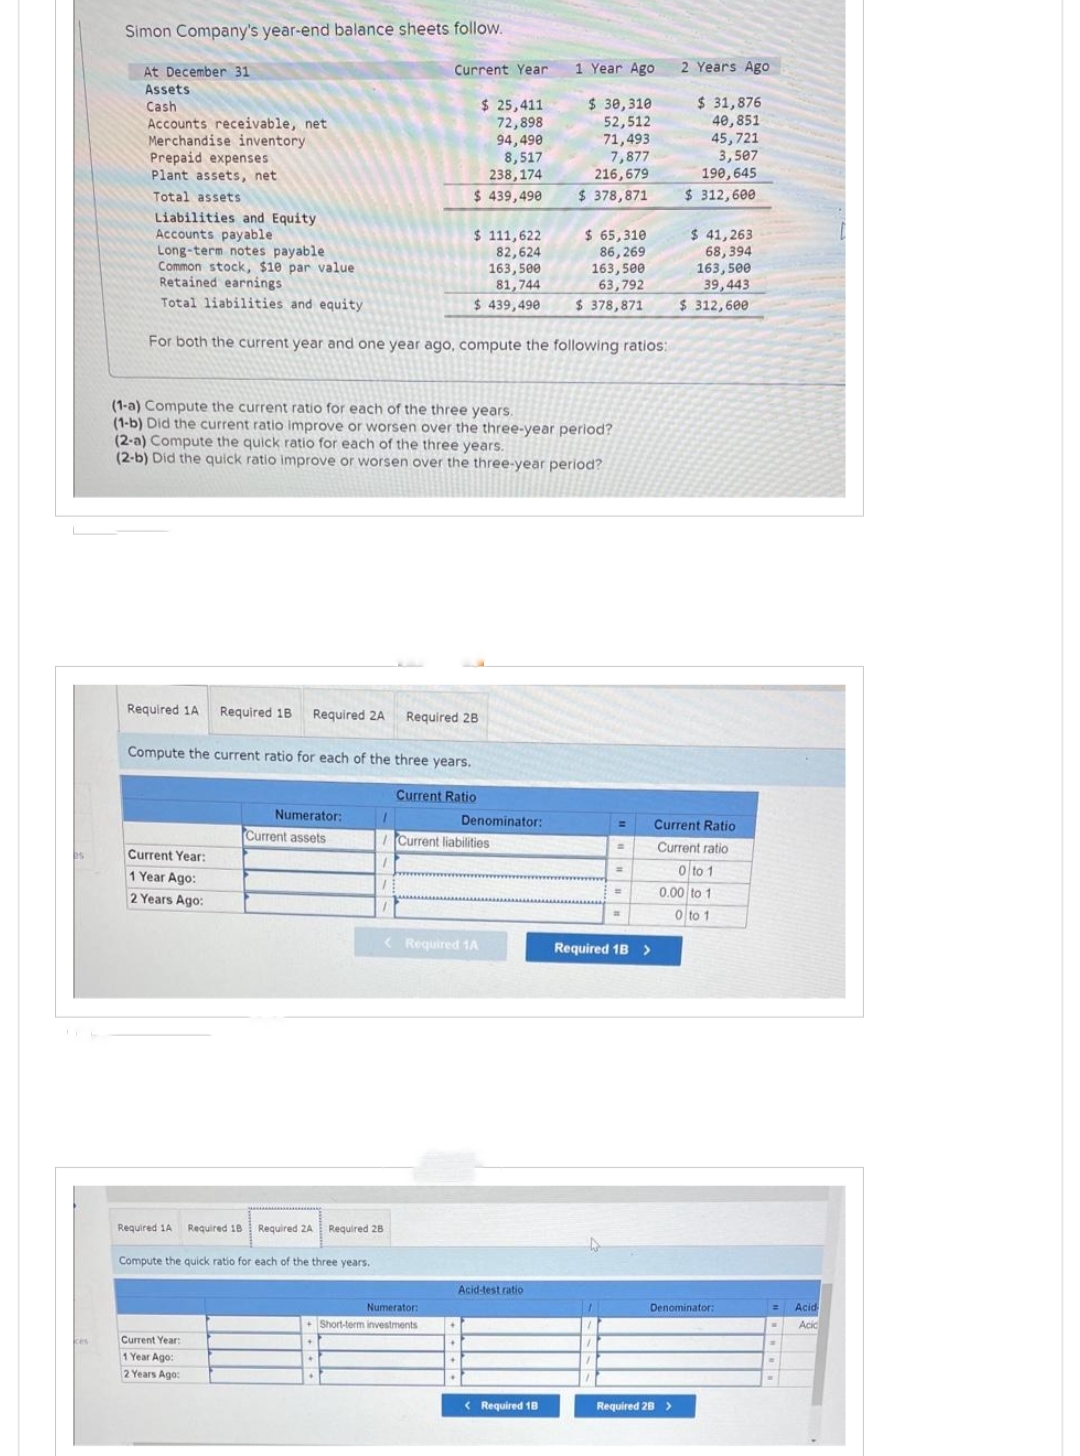

Transcribed Image Text:Simon Company's year-end balance sheets follow.
At December 31
Assets
Cash
Accounts receivable, net
Merchandise inventory
Prepaid expenses
Plant assets, net
Total assets
Current Year:
1 Year Ago:
2 Years Ago:
Required 1A Required 18
Liabilities and Equity
Accounts payable
Long-term notes payable.
Common stock, $10 par value
Retained earnings
Total liabilities and equity
For both the current year and one year ago, compute the following ratios:
Required 1A Required 1B Required 2A
Compute the current ratio for each of the three years.
Current Ratio
Numerator:
Current assets
Current Year:
1 Year Ago:
2 Years Ago:
Compute the quick ratio for each of the three years.
Current Year
(1-a) Compute the current ratio for each of the three years.
(1-b) Did the current ratio improve or worsen over the three-year period?
(2-a) Compute the quick ratio for each of the three years.
(2-b) Did the quick ratio improve or
1
$ 25,411
72,898
94,490
8,517
238,174
$ 439,490
Required 2A Required 28
$ 111,622
82,624
163,500
81,744
$439,490
Required 2B
Numerator:
Short-term investments
over the three-year period?
Denominator:
Current liabilities
< Required 1A
1 Year Ago
$ 30,310
52,512
Acid-test ratio
71,493
7,877
216,679
$ 378,871
< Required 18
$ 65,310
86,269
163,500
63,792
$ 378,871
=
Required 1B >
2 Years Ago
$ 31,876
40,851
45,721
3,507
190,645
$312,600
$ 41,263
68,394
163,500
39,443
$ 312,600
Current Ratio
Current ratio
0 to 1
0.00 to 1
0 to 1
Required 2B>
Denominator:
= Acid
Acic
Expert Solution
This question has been solved!
Explore an expertly crafted, step-by-step solution for a thorough understanding of key concepts.

This is a popular solution

Trending nowThis is a popular solution!

Step by stepSolved in 2 steps with 4 images

Knowledge Booster


Learn more about
Need a deep-dive on the concept behind this application? Look no further. Learn more about this topic, accounting and related others by exploring similar questions and additional content below.Similar questions
- Vishnuarrow_forwardAssets Cash Short-term investments Accounts receivable, net Merchandise inventory Prepaid expenses Plant assets, net Total assets CABOT CORPORATION Income Statement For Current Year Ended December 31 Sales $ 450,600 298,350 152,250 99,300 4,500 Cost of goods sold Gross profit Operating expenses Interest expense. Income before taxes Income tax expense Net income $ 10,000 Accounts payable Accrued wages payable 9,200 31,400 Income taxes payable 30,150 Long-term note payable, secured by mortgage on plant assets 3,050 Common stock 152,300 Retained earnings $ 236,100 Total liabilities and equity CABOT CORPORATION Balance Sheet December 31 of current year Liabilities and Equity 48,450 19,518 $ 28,932 $ 17,500 3,800 4,700 69,400 88,000 52,700 $ 236,100 Required: Compute the following: (1) current ratio, (2) acid-test ratio, (3) days' sales uncollected, (4) inventory turnover, (5) days' sales in inventory, (6) debt-to-equity ratio, (7) times interest earned, (8) profit margin ratio, (9) total…arrow_forwardSimon Company's year-end balance sheets follow. At December 31 Assets Cash Accounts receivable, net Merchandise inventory Prepaid expenses Plant assets, net Total assets Liabilities and Equity Accounts payable Long-term notes payable Common stock, $10 par value Retained earnings Total liabilities and equity For Year Ended December 31 Sales Cost of goods sold Other operating expenses Current Year $ 31,800 89,500 112,500. 10,700 278,500 $ 523,000 Interest expense Income tax expense Total costs and expenses Net income. Earnings per share $ 129,900 98,500 163,500 131,100 $ 523,000 Current Year $ 411,225 209,550 1 Year Ago $ 35,625 62,500 82,500 9,375 255,000 $ 445,000 The company's income statements for the current year and one year ago follow. Assume that all sales are on credit: 4 12,100 9,525 $ 75,250 101,500 163,500 104,750 $ 445,000 $ 673,500 2 Years Ago 642,400 $ 31,100 $ 1.90 $ 37,800 50,200 54,000 5,000 230,500 $ 377,500 $51,250 83,500 163,500 79,250 $ 377,500 1 Year Ago $ 345,500…arrow_forward
- Required information [The following information applies to the questions displayed below.] Simon Company's year-end balance sheets follow. At December 31 Assets Cash Accounts receivable, net Merchandise inventory Prepaid expenses Plant assets, net Total assets Liabilities and Equity Accounts payable Long-term notes payable Common stock, $10 par value Retained earnings Total liabilities and equity For Year Ended December 31 Sales Cost of goods sold Other operating expenses Current Year 1 Year Ago $ 31,099 $ 26,605 89, 200 114,500 62,900 85,000 8,568 221, 258 8,163 209,503 $ 460, 131 $ 396,665 Interest expense Income tax expense Total costs and expenses Net income Earnings per share $ 112,281 84,775 162,500 100,575 $ 460,131 $ 396,665 $ 65,696 89,408 162,500 79, 061 Current Year The company's income statements for the current year and one year ago follow. Assume that all sales are on credit: $364,884 185,433 10, 169 7,776 $598,170 2 Years Ago 568, 262 $ 29,908 $ 1.84 $ 32,725 50,800…arrow_forwardSimon Company's year-end balance sheets follow. At December 31 Current Year 1 Year Ago 2 Years Ago Assets Cash $ 32,700 $ 37,849 $ 37,130 Accounts receivable, net 94,775 65,580 51,527 Merchandise inventory 120,330 86,659 53,800 Prepaid expenses 10,118 10,034 4,252 Plant assets, net 285,450 268,303 235,991 Total assets $ 543,373 $ 468,425 $ 382,700 Liabilities and Equity Accounts payable $ 138,006 $ 78,372 $ 51,022 Long-term notes payable 100,111 107,738 83,731 Common stock, $10 par value 163,500 163,500 162,500 Retained earnings 141,756 118,815 85,447 Total liabilities and equity $ 543,373 $ 468,425 $ 382,700 For both the current year and one year ago, compute the following ratios: 1. Express the balance sheets in common-size percents.2. Assuming annual sales have not changed in the last three years, is the change in accounts receivable as a percentage of total assets favorable or unfavorable?3. Assuming annual sales have not…arrow_forwardThe income statement of Booker T Industries Inc. for the current year ended June 30 is as follows: Sales $570,960 Cost of merchandise sold 324,190 Gross profit $246,770 Operating expenses: Depreciation expense $43,810 Other operating expenses 115,830 Total operating expenses 159,640 Income before income tax S87,130 Income tax expense 24,180 Net income $62,950 Changes in the balances of selected accounts from the beginning to the end of the current year are as follows: Increase Decrease Accounts receivable (net) S(12,650) Inventories 4,410 Prepaid expenses (4,220) Accounts payable (merchandise creditors) (9,000) Accrued expenses payable (operating expenses) 1,260 Income tax payable (3,020) a. Prepare the Cash Flows from (used for) Operating Activities section of the statement of cash flows, using the direct method. Use the minus sign to indicate cash outflows, cash payments, decreases in cash, or any negative adjustments. Booker T Industries Inc. Cash Flows from Operating Activities…arrow_forward
- Required Information [The following Information applies to the questions displayed below.] Simon Company's year-end balance sheets follow. At December 31 Assets Current Year 1 Year Ago 2 Years Ago Cash $ 34,475 Accounts receivable, net 101,959 $ 42,354 70,522 Merchandise inventory Prepaid expenses Plant assets, net Total assets Liabilities and Equity Accounts payable 130,758 11,329 317,729 $ 596,250 110,974 162,500 171,340 96,043 11,118 293,972 $ 514,009 $ 86,868 118,222 162,500 146,419 $ 596,250 $ 514,009 $ 41,986 56,541 60,824 4,758 259,991 $ 424,100 $ 54,862 91,852 162,500 114,886 $ 424,100 $ 151,436 Long-term notes payable Common stock, $10 par value Retained earnings Total liabilities and equity For both the current year and one year ago, compute the following ratios: The company's Income statements for the current year and 1 year ago, follow. For Year Ended December 31 Sales Cost of goods sold Interest expense Income tax expense Other operating expenses Total costs and expenses…arrow_forwardThe financial statements of New World, Incorporated, provide the following information for the current year: December 31 January 1 Accounts receivable $ 288,000 $ 391,500 Inventory $ 281,250 $ 267,000 Prepaid expenses $ 73,200 $ 70,500 Accounts payable (for merchandise) $ 259,800 $ 251,550 Accrued expenses payable $ 66,150 $ 79,950 Net sales $ 3,172,500 Cost of goods sold $ 1,672,500 Operating expenses (including depreciation of $64,000) $ 382,500 What is New World's net cash flow from operating activities for the current year?arrow_forwardThe following information applies to the questions displayed below.]Simon Company's year-end balance sheets follow. At December 31 Current Year 1 Year Ago 2 Years Ago Assets Cash $ 32,700 $ 37,849 $ 37,130 Accounts receivable, net 94,775 65,580 51,527 Merchandise inventory 120,330 86,659 53,800 Prepaid expenses 10,118 10,034 4,252 Plant assets, net 285,450 268,303 235,991 Total assets $ 543,373 $ 468,425 $ 382,700 Liabilities and Equity Accounts payable $ 138,006 $ 78,372 $ 51,022 Long-term notes payable 100,111 107,738 83,731 Common stock, $10 par value 163,500 163,500 162,500 Retained earnings 141,756 118,815 85,447 Total liabilities and equity $ 543,373 $ 468,425 $ 382,700 The company’s income statements for the current year and 1 year ago, follow. For Year Ended December 31 Current Year 1 Year Ago Sales $ 706,385 $ 557,426 Cost of goods sold $ 430,895 $ 362,327 Other operating expenses 218,979 141,029 Interest…arrow_forward
- Simon Company's year-end balance sheets follow. At December 31 Current Year 1 Year Ago 2 Years Ago Assets Cash $ 29,484 $ 34,808 $ 35,907 Accounts receivable, net 84,598 59,105 49,830 Merchandise inventory 104,217 80,494 51,503 Prepaid expenses 9,590 8,775 4,071 Plant assets, net 271,834 247,614 228,789 Total assets $ 499,723 $ 430,796 $ 370,100 Liabilities and Equity Accounts payable $ 124,431 $ 73,533 $ 50,319 Long-term notes payable 94,887 100,074 81,792 Common stock, $10 par value 162,500 162,500 162,500 Retained earnings 117,905 94,689 75,489 Total liabilities and equity $ 499,723 $ 430,796 $ 370,100 For both the current year and one year ago, compute the following ratios: 1. Express the balance sheets in common-size percents. 2. Assuming annual sales have not changed in the last three years, is the change in accounts receivable as a percentage of total assets favorable or unfavorable? 3. Assuming annual sales have not changed in the last three years, is the…arrow_forwardAccounts Receivable and Inventory Ratios Bell Company had the following current assets at year-end: Cash $72,500 Short-term investments 123,500 Accounts receivable (net) 425,000 Inventory 500,000 Prepaid expenses 29,000 Current assets $1,150,000 The company had net sales for the year of $2,205,000 and cost of goods sold of $1,347,500.At the beginning of the year, Bell’s accounts receivable (net) were $352,000 and itsInventory was $429,000.a. What is the company’s accounts receivable turnover for the year? (Round to two decimal places.) Answer b. What is the company’s average collection period for the year? (Round to one decimal place.) Answer c. What is the company’s inventory turnover for the year? (Round to two decimal places.) Answer d. What is the company’s days’ sales in inventory for the year? (Round to one decimal place.) Answerarrow_forwardRequired Information Use the following information for the Exercises below. (Algo) [The following information applies to the questions displayed below.] Simon Company's year-end balance sheets follow. At December 31 Assets Cash Accounts receivable, net Merchandise inventory Prepaid expenses Plant assets, net Total assets Liabilities and Equity Accounts payable Long-term notes payable Common stock, $10 par value Retained earnings Total liabilities and equity Current Year 1 Year Ago 2 Years Ago $ 29,387 58,429 $ 29,125 40,023 66,638 $ 23,920 69,328 88,056 7,860 224,536 $ 413,700 7,564 282,628 $ 356,638 81,206 162,500 54,468 $101,981 76,998 $ 58,464 162,500 72,221 $ 413,780 $ 356,638 For both the current year and one year ago, compute the following ratios: 43,855 3,236 184,761 $ 300,200 $ 38,438 64,354 162,580 34,988 $ 300,200 Exercise 17-6 (Algo) Common-size percents LO P2 1. Express the balance sheets in common-size percents. 2. Assuming annual sales have not changed in the last three…arrow_forward
arrow_back_ios
SEE MORE QUESTIONS
arrow_forward_ios
Recommended textbooks for you
 AccountingAccountingISBN:9781337272094Author:WARREN, Carl S., Reeve, James M., Duchac, Jonathan E.Publisher:Cengage Learning,
 Accounting Information SystemsAccountingISBN:9781337619202Author:Hall, James A.Publisher:Cengage Learning,
 Horngren's Cost Accounting: A Managerial Emphasis...AccountingISBN:9780134475585Author:Srikant M. Datar, Madhav V. RajanPublisher:PEARSON
 Intermediate AccountingAccountingISBN:9781259722660Author:J. David Spiceland, Mark W. Nelson, Wayne M ThomasPublisher:McGraw-Hill Education
 Financial and Managerial AccountingAccountingISBN:9781259726705Author:John J Wild, Ken W. Shaw, Barbara Chiappetta Fundamental Accounting PrinciplesPublisher:McGraw-Hill Education
Accounting
Accounting
ISBN:9781337272094
Author:WARREN, Carl S., Reeve, James M., Duchac, Jonathan E.
Publisher:Cengage Learning,
Accounting Information Systems
Accounting
ISBN:9781337619202
Author:Hall, James A.
Publisher:Cengage Learning,
Horngren's Cost Accounting: A Managerial Emphasis...
Accounting
ISBN:9780134475585
Author:Srikant M. Datar, Madhav V. Rajan
Publisher:PEARSON
Intermediate Accounting
Accounting
ISBN:9781259722660
Author:J. David Spiceland, Mark W. Nelson, Wayne M Thomas
Publisher:McGraw-Hill Education
Financial and Managerial Accounting
Accounting
ISBN:9781259726705
Author:John J Wild, Ken W. Shaw, Barbara Chiappetta Fundamental Accounting Principles
Publisher:McGraw-Hill Education