
MATLAB: An Introduction with Applications
6th Edition
ISBN: 9781119256830
Author: Amos Gilat
Publisher: John Wiley & Sons Inc
expand_more
expand_more
format_list_bulleted
Related questions
Question
I need assistance finding the P-value
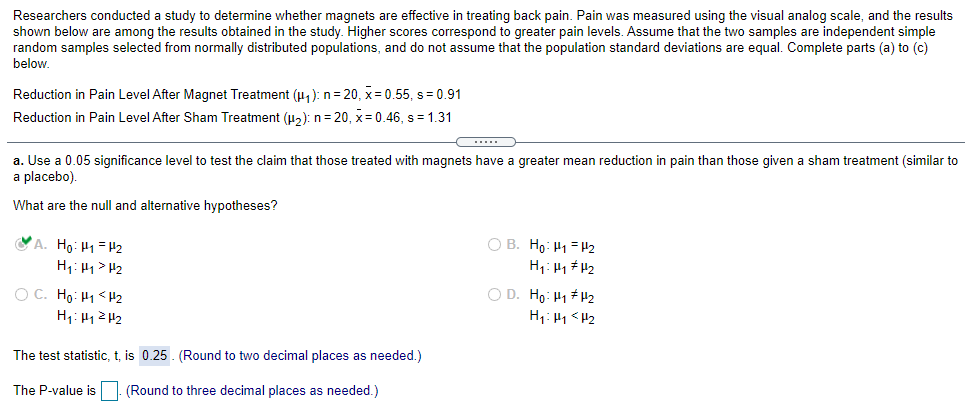

Transcribed Image Text:Researchers conducted a study to determine whether magnets are effective in treating back pain. Pain was measured using the visual analog scale, and the results
shown below are among the results obtained in the study. Higher scores correspond to greater pain levels. Assume that the two samples are independent simple
random samples selected from normally distributed populations, and do not assume that the population standard deviations are equal. Complete parts (a) to (c)
below.
Reduction in Pain Level After Magnet Treatment (u, ): n= 20, x= 0.55, s= 0.91
Reduction in Pain Level After Sham Treatment (H2): n= 20, x= 0.46, s = 1.31
a. Use a 0.05 significance level to test the claim that those treated with magnets have a greater mean reduction in pain than those given a sham treatment (similar to
a placebo).
What are the null and alternative hypotheses?
VA. Họ: H1 = H2
H1: H1 > H2
O B. Ho: H1 = H2
O C. Ho: H1 <H2
H1: H12 H2
O D. Ho: H1 # H2
H1: H1 < H2
The test statistic, t, is 0.25 . (Round to two decimal places as needed.)
The P-value is (Round to three decimal places as needed.)
Expert Solution
This question has been solved!
Explore an expertly crafted, step-by-step solution for a thorough understanding of key concepts.

This is a popular solution

Trending nowThis is a popular solution!

Step by stepSolved in 2 steps with 2 images

Knowledge Booster

Similar questions
- Q11arrow_forwardA researcher found that the two groups (n=25 in each group) they tested were significantly different from each other with a t-value of 2.91, which has a corresponding p-value of p=.06. Report the findings in APA number format.arrow_forwardAthletes performing in bright sunlight often smear black eye grease under their eyes to reduce glare. Does eye grease work? In one study, 16 student subjects took a test of sensitivity to contrast after three hours facing into bright sun, both with and without eye grease. (Greater sensitivity to contrast improves vision, and glare reduces sensitivity to contrast.) This is a matched pairs design. The differences in sensitivity, with eye grease minus without eye grease, are given in the table. 0.07 0.64 −0.12 −0.05 −0.18 0.14 −0.16 0.03 0.05 0.02 0.43 0.24 −0.11 0.28 0.05 0.29 Click to download the data in your preferred format. CSV Excel JMP Mac-Text Minitab14-18 Minitab18+ PC-Text R SPSS TI CrunchIt! How much more sensitive to contrast are athletes with eye grease than without eye grease? Give a 95% confidence interval to answer this question. Give your answers to four decimal places. lower bound: upper bound:arrow_forward
- I need help with the first question: Find the z-score value associated with a guess of 38.arrow_forwardSuppose the mean of Y is 99. What does the mean of X become if you multiply X by 1.37? (Use two decimal places, ex: 12.34)arrow_forwardFind the z-score corresponding to a score of X=50. u=60 and o=5 u=45 and o=5 u=40 and o=5 u=37 and o=5 u=59 and o=5arrow_forward
- Harper collected data on students who make appointments to see their advisor to see how many failed to show up. The student records were divided into two groups: male (group 1) and female (group 2). A 93% confidnece interval for pi – P2 was found to be as follows: (0.03, 0.09) Interpret the endpoints of this interval in the context of this problem. Do not use the word "difference" in your answer.arrow_forwardWhat is the relationship between R sqare and p-value?arrow_forwardSee picture for problem.arrow_forward
arrow_back_ios
arrow_forward_ios
Recommended textbooks for you
- MATLAB: An Introduction with ApplicationsStatisticsISBN:9781119256830Author:Amos GilatPublisher:John Wiley & Sons Inc
 Probability and Statistics for Engineering and th...StatisticsISBN:9781305251809Author:Jay L. DevorePublisher:Cengage Learning
 Statistics for The Behavioral Sciences (MindTap C...StatisticsISBN:9781305504912Author:Frederick J Gravetter, Larry B. WallnauPublisher:Cengage Learning
  Elementary Statistics: Picturing the World (7th E...StatisticsISBN:9780134683416Author:Ron Larson, Betsy FarberPublisher:PEARSON
 The Basic Practice of StatisticsStatisticsISBN:9781319042578Author:David S. Moore, William I. Notz, Michael A. FlignerPublisher:W. H. Freeman
 Introduction to the Practice of StatisticsStatisticsISBN:9781319013387Author:David S. Moore, George P. McCabe, Bruce A. CraigPublisher:W. H. Freeman
MATLAB: An Introduction with Applications
Statistics
ISBN:9781119256830
Author:Amos Gilat
Publisher:John Wiley & Sons Inc
Probability and Statistics for Engineering and th...
Statistics
ISBN:9781305251809
Author:Jay L. Devore
Publisher:Cengage Learning
Statistics for The Behavioral Sciences (MindTap C...
Statistics
ISBN:9781305504912
Author:Frederick J Gravetter, Larry B. Wallnau
Publisher:Cengage Learning
Elementary Statistics: Picturing the World (7th E...
Statistics
ISBN:9780134683416
Author:Ron Larson, Betsy Farber
Publisher:PEARSON
The Basic Practice of Statistics
Statistics
ISBN:9781319042578
Author:David S. Moore, William I. Notz, Michael A. Fligner
Publisher:W. H. Freeman
Introduction to the Practice of Statistics
Statistics
ISBN:9781319013387
Author:David S. Moore, George P. McCabe, Bruce A. Craig
Publisher:W. H. Freeman