Elements Of Electromagnetics
7th Edition
ISBN: 9780190698614
Author: Sadiku, Matthew N. O.
Publisher: Oxford University Press
expand_more
expand_more
format_list_bulleted
Concept explainers
Question
- Show your calculation for the method 2 velocity. Explain how it compared to the reading from your velocity vs. time graph.

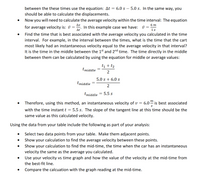
Transcribed Image Text:between the these times use the equation: At = 6.0 s – 5.0 s. In the same way, you
should be able to calculate the displacements.
Now you will need to calculate the average velocity within the time interval: The equation
Ax
6 т
for average velocity is: ū =. ū =
1s
In this example case we have: i
At
Find the time that is best associated with the average velocity you calculated in the time
interval. For example, in the interval between the times, what is the time that the cart
most likely had an instantaneous velocity equal to the average velocity in that interval?
It is the time in the middle between the 1st and 2nd time. The time directly in the middle
between them can be calculated by using the equation for middle or average values:
t1 + t2
tmiddle
2
5.0 s + 6.0 s
tmiddle
2
tmiddle = 5.5 s
Therefore, using this method, an instantaneous velocity of v = 6.0“ is best associated
with the time instant t = 5.5 s. The slope of the tangent line at this time should be the
same value as this calculated velocity.
Using the data from your table include the following as part of your analysis:
Select two data points from your table. Make them adjacent points.
Show your calculation to find the average velocity between these points.
Show your calculation to find the mid-time, the time when the car has an instantaneous
velocity the same as the average you calculated.
Use your velocity vs time graph and how the value of the velocity at the mid-time from
the best-fit line.
Compare the calcuation with the graph reading at the mid-time.

Transcribed Image Text:Method 2 using information from the data table: Calculating the average velocity between two
values of position and time.
time (sec)
Position (m)
Notice that the header is
not complete. Do you
know what is missing?
Example
Be sure to make the
5.0
11.0
Calculation
headers in your table
6.0
17.0
complete.
Here is an example using two position/time data points to calculate the velocity at the
mid-time. Calculate the time interval. For example, to calculate the time interval
Expert Solution
This question has been solved!
Explore an expertly crafted, step-by-step solution for a thorough understanding of key concepts.
Step by stepSolved in 2 steps with 1 images

Knowledge Booster
Learn more about
Need a deep-dive on the concept behind this application? Look no further. Learn more about this topic, mechanical-engineering and related others by exploring similar questions and additional content below.Similar questions
- 1. The graph in Fig. A shows the velocity of an ambulance vehicle driver plotted as a function of time. How far does the officer go in the first 3 seconds? The first 7 seconds? The first 11 seconds? Vx (m/s) 50 45 40 35 30 25 Fig. A 20 15 10 5 t (s) 2 4 6 !8 10 12 14 7 11 3.arrow_forwardcan I get simplest way to get that answer ....arrow_forwardQ1/ The figure below shows such an LSPB trajectory, where the maximum velocity V 60 deg/sec. In this case, the times are given as t.= 5 sec and t 30 sec. In addition, the joint angles in beginning and the ending q=20 deg and qf = 70 deg , respectively. For these required data , determine the following : 1- The position function and its profile. 2- The velocity function and its profile. 3- The acceleration function and its profile. 4- The function of jerk variable and what is the nature of jerk? 5- The position, velocity, and acceleration at tm-13 sec. te tm ty te ty tarrow_forward
- (1-C.s) m/s² where Cis a constant and sis Q13. The acceleration of a particle traveling along a straight line is a the position in m. If the constant Cis 0.1, the initial velocity vo is 0, and the initial position so = 1.7 m at time t = 0, determine the particle's velocity v when its position s = 4.8 m. Please pay attention: the numbers may change since they are randomized. Your answer must include 3 places after the decimal point, and proper Sl unit. Answer: =arrow_forwardUse t'=20.4 instead of 8.4 and use the formulas attachedarrow_forward
arrow_back_ios
arrow_forward_ios
Recommended textbooks for you
 Elements Of ElectromagneticsMechanical EngineeringISBN:9780190698614Author:Sadiku, Matthew N. O.Publisher:Oxford University Press
 Mechanics of Materials (10th Edition)Mechanical EngineeringISBN:9780134319650Author:Russell C. HibbelerPublisher:PEARSON
 Thermodynamics: An Engineering ApproachMechanical EngineeringISBN:9781259822674Author:Yunus A. Cengel Dr., Michael A. BolesPublisher:McGraw-Hill Education
 Control Systems EngineeringMechanical EngineeringISBN:9781118170519Author:Norman S. NisePublisher:WILEY
 Mechanics of Materials (MindTap Course List)Mechanical EngineeringISBN:9781337093347Author:Barry J. Goodno, James M. GerePublisher:Cengage Learning
 Engineering Mechanics: StaticsMechanical EngineeringISBN:9781118807330Author:James L. Meriam, L. G. Kraige, J. N. BoltonPublisher:WILEY

Elements Of Electromagnetics
Mechanical Engineering
ISBN:9780190698614
Author:Sadiku, Matthew N. O.
Publisher:Oxford University Press

Mechanics of Materials (10th Edition)
Mechanical Engineering
ISBN:9780134319650
Author:Russell C. Hibbeler
Publisher:PEARSON

Thermodynamics: An Engineering Approach
Mechanical Engineering
ISBN:9781259822674
Author:Yunus A. Cengel Dr., Michael A. Boles
Publisher:McGraw-Hill Education

Control Systems Engineering
Mechanical Engineering
ISBN:9781118170519
Author:Norman S. Nise
Publisher:WILEY

Mechanics of Materials (MindTap Course List)
Mechanical Engineering
ISBN:9781337093347
Author:Barry J. Goodno, James M. Gere
Publisher:Cengage Learning

Engineering Mechanics: Statics
Mechanical Engineering
ISBN:9781118807330
Author:James L. Meriam, L. G. Kraige, J. N. Bolton
Publisher:WILEY