
Related questions
Show supporting work for each section
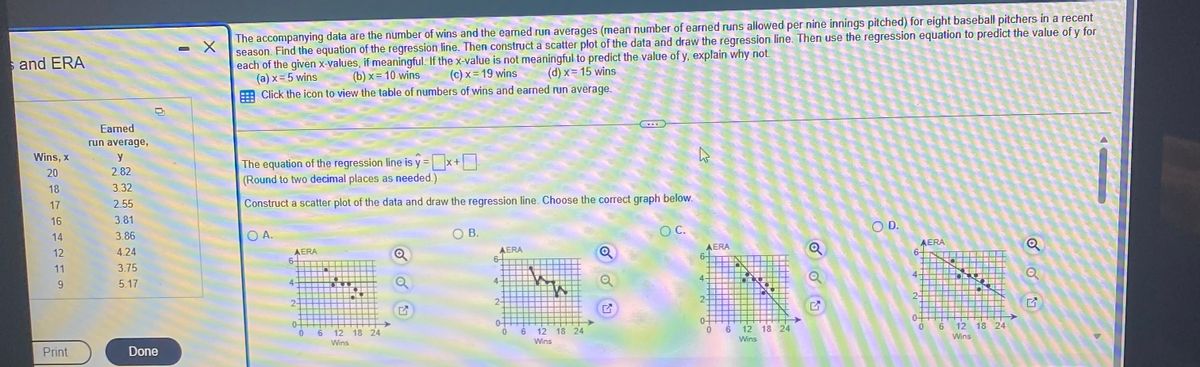
find regression equation
choose correct graph
a) predict the ERA for wins if it meaningful y=
b) predict the ERA for 10 wins if it meaningful y=
c) predict the ERA for 19 wins if it meaningful y=
d) predict the ERA for 15 wins if it meaningful y=
complete table
find the slope & intercept of the regression line


Trending nowThis is a popular solution!

Step by stepSolved in 7 steps with 1 images

The equation of the regression line y=6.41x + blank
there is minus on the answer here that wouldn't be correct & would make all A-D predict ERA answers incorrect
The equation of the regression line y=6.41x + blank
there is minus on the answer here that wouldn't be correct & would make all A-D predict ERA answers incorrect

- I couldn't include the options for the graphs because it only allows me to add two pictures.arrow_forwardDevelop a scatterplot and explore the correlation between customer age and net sales by each type of customer (regular/promotion). Use the horizontal axis for the customer age to graph. Find the linear regression line that models the data by each type of customer. Round the rate of changes (slopes) to two decimal places and interpret them in terms of the relation between the change in age and the change in net sales. What can you conclude? Hint: Rate of Change = Vertical Change / Horizontal Change = Change in y / Change in xarrow_forwardAriel was running analyses over and over in census data and came across a correlation between weight and debt (r=.78). Independent variable is weight and dependent variable is debt. b) Curious Ariel noted some statistics on these weight (M=160lb, SD=15lb) and debt (M=196k, SD=20k). If Ariel wanted to calculate a regression equation, what would her slope and intercept be?arrow_forward
- The data show The chest size and weight of several bears find regression equation, letting chest size be the independent variable then find the best predicted weight of a bear with a chest size of 51 inches is the result close to the actual weight of 422 pounds use a significance level of 0.05 Chest size : 45, 50, 43, 43, 52, 52. Weight : 352, 374, 275, 314, 440, 367.arrow_forwardSelect which equation best models the data graphed on the coordinate plane. 0 -1- --2- -3 5 -8- y=-4x6 y = x-6 y=-x − 6 y = 4x 6 - y=1/x-7 y = 4x - 7 3 4arrow_forwardRange of ankle motion is a contributing factor to falls among the elderly. Suppose a team of researchers is studying how compression hosiery, typical shoes, and medical shoes affect range of ankle motion. In particular, note the variables Barefoot and Footwear2. Barefoot represents a subject's range of ankle motion (in degrees) while barefoot, and Footwear2 represents their range of ankle motion (in degrees) while wearing medical shoes. Use this data and your preferred software to calculate the equation of the least-squares linear regression line to predict a subject's range of ankle motion while wearing medical shoes, ?̂ , based on their range of ankle motion while barefoot, ? . Round your coefficients to two decimal places of precision. ?̂ = A physical therapist determines that her patient Jan has a range of ankle motion of 7.26°7.26° while barefoot. Predict Jan's range of ankle motion while wearing medical shoes, ?̂ . Round your answer to two decimal places. ?̂ = Suppose Jan's…arrow_forward
- Data was collected for a regression analysis comparing car weight and fuel consumption. b0 was found to be 32.7, b1 was found to be -7.6, and R2 was found to be 0.86. Interpret the y-intercept of the line. On average, each one unit increase in the weight of a car decreases its ful consumption by 7.6 units. On average, when x=0, a car gets -7.6 miles per gallon. On average, when x=0, a car gets 32.7 miles per gallon. On average, each one unit increase in the weight of a car increases its fuel comsumption by 32.7 units. We should not interpret the y-intercept in this problem.arrow_forwardplease please help me i need helparrow_forward
- MATLAB: An Introduction with ApplicationsStatisticsISBN:9781119256830Author:Amos GilatPublisher:John Wiley & Sons Inc
 Probability and Statistics for Engineering and th...StatisticsISBN:9781305251809Author:Jay L. DevorePublisher:Cengage Learning
 Statistics for The Behavioral Sciences (MindTap C...StatisticsISBN:9781305504912Author:Frederick J Gravetter, Larry B. WallnauPublisher:Cengage Learning
  Elementary Statistics: Picturing the World (7th E...StatisticsISBN:9780134683416Author:Ron Larson, Betsy FarberPublisher:PEARSON
 The Basic Practice of StatisticsStatisticsISBN:9781319042578Author:David S. Moore, William I. Notz, Michael A. FlignerPublisher:W. H. Freeman
 Introduction to the Practice of StatisticsStatisticsISBN:9781319013387Author:David S. Moore, George P. McCabe, Bruce A. CraigPublisher:W. H. Freeman