A First Course in Probability (10th Edition)
10th Edition
ISBN: 9780134753119
Author: Sheldon Ross
Publisher: PEARSON
expand_more
expand_more
format_list_bulleted
Concept explainers
Question
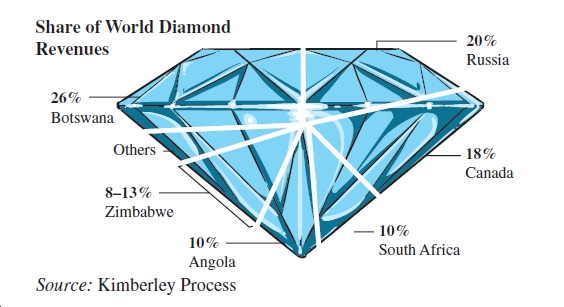
Much of the world's diamond industry is located in Africa, with Russia and Canada also showing large revenues from their diamond mining industry. A visual representation of the various shares of the world’s diamond revenues, adapted from Time Magazine,15 is shown below:
See Attachment
a. Draw a pie chart to describe the various shares of the world’s diamond revenues.
b. Draw a bar chart to describe the various shares of the world’s diamond revenues.
c. Draw a Pareto chart to describe the various shares of the world’s diamond revenues.
d. Which of the charts is the most effective in describing the data?

Transcribed Image Text:Share of World Diamond
20%
Revenues
Russia
26%
Botswana
Others
18%
Canada
8-13%
Zimbabwe
10%
10%
South Africa
Angola
Source: Kimberley Process
Expert Solution
This question has been solved!
Explore an expertly crafted, step-by-step solution for a thorough understanding of key concepts.
This is a popular solution
Trending nowThis is a popular solution!
Step by stepSolved in 5 steps with 5 images

Knowledge Booster
Learn more about
Need a deep-dive on the concept behind this application? Look no further. Learn more about this topic, probability and related others by exploring similar questions and additional content below.Similar questions
- Dashboard C YouTube X M MyOpenMath ✔ Hints myopenmath.com/assess2/index.php?cid=167606&aid=11945494&r=641ba54e2ba44#/skip/13 myMCC | Middlesex... Dashboard = Google Docs NJ Athletic Confere... a) 68% of the students spend between b) 95% of the students spend between c) 99.7% of the students spend between Question Help: Submit Question Jump to Answer Untitled document - Google X ■ ■ For a 4-unit class like Statistics, students should spend average of 12 hours studying for the class. A survey was done on 23 students, and the distribution of total study hours per week is bell-shaped with a mean of 14 hours and a standard deviation of 3.4 hours. Use the Empirical Rule to answer the following questions. Q Search 2021 Football Stan... V 2021-2022 D3 Colle... GroupMe P Plagiarism Checker... MyOpen Math hours and hours and Written Example Message instructor Sy 1-(30)^5 hours and Answered: How the Classic X + VitalSource Booksh... hours on Statistics each week. 19 ☆ hours on Statistics each…arrow_forwardIn a new subdivision, six homes cost $75000, eight homes cost $80000, and six homes cost $105000. What is the sum of the weighted average and the mode of these homes' costs? $166300 $166000 $167400 O $165000 O $165200arrow_forwardIn a recent survey, a group of people were asked if they were happy or unhappy with the state of the country. The data are shown in the contingency table below, organized by political party. What is the relative risk of being unhappy with the state of the country for Democrats? Round your answer to two decimal places. Нарру | Unhappy | Total Republican 152 98 250 Democrat 104 146 250 Total 256 244 500 Provide your answer below:arrow_forward
- A pipeline network will be built that will connect six cities. Costs (in hundreds million dollars) to build these pipelines depending on the distance shown by the weighted graph below. Find a pipeline system for connecting all cities but with minimal total cost.arrow_forwardd. Let’s define a “binge watcher” as someone in the upper 5% of the distribution of minutes watching TV. How many minutes does a “binge watcher” spend per day watching TV? (Round your intermediate calculations and final answer to 1 decimal place.)arrow_forwardConsumer Reports rated automobile insurance companies and gave annual premiums for top-rated companies in several states. The figure below shows premiums for urban customers (married couple with one 17-year-old son) in three states. The box plots were all drawn using the same scale on a TI-8- Texas Pennsylvania California (a) Which state has the lowest premium? the highest? O lowest, California; highest, Texas O lowest, Texas; highest, Pennsylvania O lowest, Pennsylvania; highest, California lowest, California; highest, Pennsylvaniaarrow_forward
- Here are some summary statistics for the numbers of hectares of olives and apples harvested per region, for area that planted those crops. In Region A, there were 36 hectares of olives harvested and 18 hectares of Apples harvested. Relative to its crop, which plant had a better harvest? A: They had equally good harvests relative to their crops. B: The Olives. C: It’s impossible to say without seeing all of the harvest amounts. D: The Apples.arrow_forwardA polling company reported that 37% of 1018 surveyed adults said that rising gas prices are "very harmful." Complete parts (a) through (d) below. a. What is the exact value that is 37% of 1018? The exact value is. (Type an integer or a decimal.) b. Could the result from part (a) be the actual number of adults who said that rising gas prices are "very harmful"? Why or why not? O A. No, the result from part (a) could not be the actual number of adults who said that rising gas prices are "very harmful" because that is a very rare opinion. O B. No, the result from part (a) could not be the actual number of adults who said that rising gas prices are "very harmful" because a count of people must result in a whole number. O C. Yes, the result from part (a) could be the actual number of adults who said that rising gas prices are "very harmful" because the results are statistically significant. D. Yes, the result from part (a) could be the actual number of adults who said that rising gas prices…arrow_forward
arrow_back_ios
arrow_forward_ios
Recommended textbooks for you
 A First Course in Probability (10th Edition)ProbabilityISBN:9780134753119Author:Sheldon RossPublisher:PEARSON

A First Course in Probability (10th Edition)
Probability
ISBN:9780134753119
Author:Sheldon Ross
Publisher:PEARSON
