MATLAB: An Introduction with Applications
6th Edition
ISBN: 9781119256830
Author: Amos Gilat
Publisher: John Wiley & Sons Inc
expand_more
expand_more
format_list_bulleted
Question

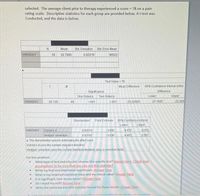
Transcribed Image Text:selected. The average client prior to therapy experienced a score = 78 on a pain
rating scale. Descriptive statistics for each group are provided below. At test was
Conducted, and the data is below.
Mean
Std. Deviation
Std. Error Mean
VARO0001
50
52.7800
6.82519
96523
Test Value = 78
df
Mean Difference
95% Confidence Interval of the
Difference
Significance
Two-Sided p
One-Sided p
Lower
Upper
VARO0001
-26.129
49
<001
<001
-25 22000
-27.1597
-23 280
Standardizer
Point Estimate
95% Confidence Interval
Lower
Upper
VARO0001
Cohen's d
6.82519
-3.695
4472
-2.912
Hedges' corredion
6.93193
-3.638
4.403
-2.867
a. The denominator used in estimating the effect sizes.
Cohen's duses the sample standard devation.
Hedges' correction uses the sahple standard deviation, plus a correction factor.
For this problem:
What type of test and why did I choose this specific test? Answer here Check your
assumptions to be sure that you can uUse this statistic!
Write my Null and alternative hypotheses. Answer here
What is my obtained statistical value and my critical value? Answer here
• Is it significant, how do you know? Answer here
Do I reject my null? Answer here
Write the sentence and APA statistics format for these results. Answer here
Expert Solution
This question has been solved!
Explore an expertly crafted, step-by-step solution for a thorough understanding of key concepts.
This is a popular solution
Trending nowThis is a popular solution!
Step by stepSolved in 5 steps with 2 images

Knowledge Booster
Similar questions
- 34arrow_forwardRefer to the data set in the accompanying table. Assume that the paired sample data is a simple random sample and the differences have a distribution that is approximately normal. Use a significance level of 0.05 to test for a difference between the weights of discarded paper (in pounds) and weights of discarded plastic (in pounds). E Click the icon to view the data. In this example, Hg is the mean value of the differences d for the population of all pairs of data, where each individual difference d is defined as the weight of discarded paper minus the weight of discarded plastic for a household. What are the null and alternative hypotheses for the hypothesis test? O A. Ho: Ha = 0 H,: Ha #0 O B. Ho: Ha #0 H1: Hd =0 O C. Ho: Ha #0 O D. Ho: Ha = 0 H1: Hd 0arrow_forwardFind the three measures of central tendency (the mean, median, and mode). (If an anewer does not exist, enter DNE.) 0, 1, 1, 2, 3, 4, 12, 33 mean median mode Need Help? Read R Additional Materialsarrow_forward
arrow_back_ios
arrow_forward_ios
Recommended textbooks for you
 MATLAB: An Introduction with ApplicationsStatisticsISBN:9781119256830Author:Amos GilatPublisher:John Wiley & Sons Inc
 Probability and Statistics for Engineering and th...StatisticsISBN:9781305251809Author:Jay L. DevorePublisher:Cengage Learning
 Statistics for The Behavioral Sciences (MindTap C...StatisticsISBN:9781305504912Author:Frederick J Gravetter, Larry B. WallnauPublisher:Cengage Learning
 Elementary Statistics: Picturing the World (7th E...StatisticsISBN:9780134683416Author:Ron Larson, Betsy FarberPublisher:PEARSON
 The Basic Practice of StatisticsStatisticsISBN:9781319042578Author:David S. Moore, William I. Notz, Michael A. FlignerPublisher:W. H. Freeman
 Introduction to the Practice of StatisticsStatisticsISBN:9781319013387Author:David S. Moore, George P. McCabe, Bruce A. CraigPublisher:W. H. Freeman

MATLAB: An Introduction with Applications
Statistics
ISBN:9781119256830
Author:Amos Gilat
Publisher:John Wiley & Sons Inc

Probability and Statistics for Engineering and th...
Statistics
ISBN:9781305251809
Author:Jay L. Devore
Publisher:Cengage Learning

Statistics for The Behavioral Sciences (MindTap C...
Statistics
ISBN:9781305504912
Author:Frederick J Gravetter, Larry B. Wallnau
Publisher:Cengage Learning

Elementary Statistics: Picturing the World (7th E...
Statistics
ISBN:9780134683416
Author:Ron Larson, Betsy Farber
Publisher:PEARSON

The Basic Practice of Statistics
Statistics
ISBN:9781319042578
Author:David S. Moore, William I. Notz, Michael A. Fligner
Publisher:W. H. Freeman

Introduction to the Practice of Statistics
Statistics
ISBN:9781319013387
Author:David S. Moore, George P. McCabe, Bruce A. Craig
Publisher:W. H. Freeman