
MATLAB: An Introduction with Applications
6th Edition
ISBN: 9781119256830
Author: Amos Gilat
Publisher: John Wiley & Sons Inc
expand_more
expand_more
format_list_bulleted
Related questions
Question
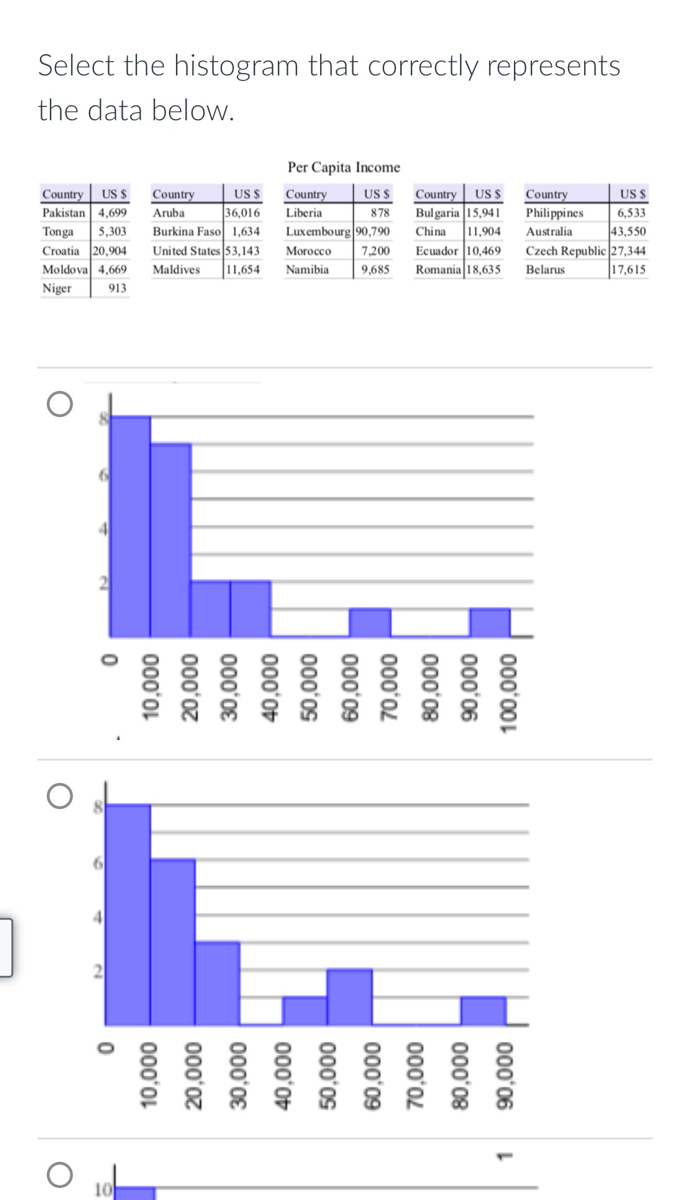

Transcribed Image Text:Select the histogram that correctly represents
the data below.
Per Capita Income
Country US S
Pakistan 4,699
US S
US S
36,016
Burkina Faso 1,634
Country US S
Bulgaria 15,941
China 11,904
Ecuador 10,469
Romania 18,635
US S
6,533
43,550
Czech Republic 27,344
17,615
Country
Aruba
Country
Country
Liberia
878
Philippines
Luxembourg 90,790
Australia
Tonga
Croatia 20,904
Moldova 4,669
5,303
United States 53,143
11,654
Morocco
7,200
Maldives
Namibia
9,685
Belarus
Niger
913
4
2
4
2
10
000'00L
000'06
000'06
000'08
000'08
000'0L
000'0L
000'09
000'09
000'0s
000'0t
000'0E
000'0z
000'07
000'0L
000'0L

Transcribed Image Text:000'00L
000'06
1.
000'00L
000'00L
000'06
000'06
000'08
000'06
000'08
000'08
000'02
000'08
000'0L
000'0L
000'09
000'0L
000'09
000'09
000'09
000'os
000'0s
000'os
000'09
000'0r
000'0t
000'07
000'0t
000'0E
000'0€
000'0€
000'0E
000'07
000'oz
000'07
000'0z
000'0L
000'0L
000'0L
000'0L
2)
Expert Solution
This question has been solved!
Explore an expertly crafted, step-by-step solution for a thorough understanding of key concepts.

This is a popular solution

Trending nowThis is a popular solution!

Step by stepSolved in 3 steps with 2 images

Knowledge Booster

Similar questions
- Here's the dataset: Golfer Distance Accuracy Index Woods 316.1 54.6 3.58 Perry 304.7 63.4 3.48 Gutschewski 310.5 57.9 3.27 Wetterich 311.7 56.6 3.18 Hearn 295.2 68.5 2.82 Gronberg 301.4 63.2 2.74 Frazar 301 63.5 2.74 Warren 299.2 64.2 2.55 Glover 302.2 60.7 2.27 MacKenzie 300.2 62.1 2.22 Love III 305.4 57.9 2.21 Garcia 303.5 59.4 2.21 Durant 289.2 70.9 2.2 O'Hair 300.1 61.4 2.02 Singh 301.1 60.2 1.92 Long 298.3 62.4 1.9 Smith 300.8 60.2 1.85 Hend 318.9 45.4 1.89 Hughes 291.3 67.5 1.76 Stadler 300.1 60.4 1.76 Allenby 297.7 62.3 1.75 Mayfair 288.2 69.8 1.71 Appleby 300.6 59.3 1.58 Snyder III 291.8 66.3 1.56 Purdy 295.2 63.4 1.52 Brigman 295.5 63.1 1.5 Bryant 283.2 73 1.49 Rollins 294.4 63.7 1.43 Jobe 302.3 57.3 1.42 Brehaut 286.6 69.9 1.4 Ogilvy 298 60.7 1.4 Henry 297.6 61 1.4 Rose 294.1 63.7 1.37 Westwood 296.8 61.5 1.36 Johnson 290 66.9 1.34 Senden 291 66 1.31 Mickelson 300 58.7 1.3 Watney 298.9 59.4 1.26…arrow_forwardQuestion and data are attached as images. Thank you and will give thumbs up! Data is typed below as well. Non_Stop_Flights one_Stop_flights 1434.9 1556.2 1653.18 1549.33 1617.95 1511.14 1668.19 1497.84 1809.16 1882.04 1641.15 1600.5 1494.61 1699.01 1776.6 1582.12 1894.51 1502.09arrow_forwardDetermine which of the four levels of measurement ( norminal, ordinal, interval, ratio) is most appropriate for the data below. Years in which U.S. presidents were inauguratedarrow_forward
- A) which city represents the 90th percentile? B)what percentile is Camrose?arrow_forwardwrite down the eight famous steps that are used to conduct correlation Geography Population Government Expenditure ($) City of Kenai 7,551 14,099,000 City of Wasilla 8,972 13,629,000 City of Foley 16,741 27,753,000 City of Hoover 84,100 93,696,000 City of Prattville 35,107 26,955,000 City of Hot Springs 36,711 10,477,000 City of Avondale 80,631 45,937,000 City of Coolidge 12,073 9,521,000 City of Douglas 16,764 13,096,000 City of Sedona 10,209 14,908,000 City of Tempe 174,708 186,195,000 City of Baldwin Park 76,511 26,460,000 City of Bell Gardens 42,805 25,869,000 City of Camarillo 66,630 32,828,000 City of Campbell 40,788 42,043,000 City of Dixon 19,144 14,700,000 City of El Cerrito 24,646 31,313,000 City of Fort Bragg 7,260 8,475,000 City of Half Moon Bay 12,281 8,781,000 City of Hesperia 92,664 26,757,000 City of Lathrop 20,331 19,195,000 City of Newark 44,677 41,230,366 City of Ontario 169,389 203,191,000 City of Pasadena 140,268…arrow_forwardThe personnel files of all eight employees at the Pawnee location of Acme Carpet Cleaners Inc. revealed that during the last 6-month period they lost the following number of days due to illness: 5 5 4 4 1 2 All eight employees during the same period at the Chickpee location of Acme Carpets revealed they lost the following number of days due to illness: Range Mean 2 1 0 10 2 2 3 0 0 6 Click here for the Excel Data File Required: a. Calculate the range and mean for the Pawnee location and the Chickpee location. (Round the "Mean" to 2 decimal places.) Pawnee location O Chickpee location O Pawnee location Chickpee location b-1. Based on the data which location has fewer lost days?arrow_forward
arrow_back_ios
arrow_forward_ios
Recommended textbooks for you
- MATLAB: An Introduction with ApplicationsStatisticsISBN:9781119256830Author:Amos GilatPublisher:John Wiley & Sons Inc
 Probability and Statistics for Engineering and th...StatisticsISBN:9781305251809Author:Jay L. DevorePublisher:Cengage Learning
 Statistics for The Behavioral Sciences (MindTap C...StatisticsISBN:9781305504912Author:Frederick J Gravetter, Larry B. WallnauPublisher:Cengage Learning
  Elementary Statistics: Picturing the World (7th E...StatisticsISBN:9780134683416Author:Ron Larson, Betsy FarberPublisher:PEARSON
 The Basic Practice of StatisticsStatisticsISBN:9781319042578Author:David S. Moore, William I. Notz, Michael A. FlignerPublisher:W. H. Freeman
 Introduction to the Practice of StatisticsStatisticsISBN:9781319013387Author:David S. Moore, George P. McCabe, Bruce A. CraigPublisher:W. H. Freeman
MATLAB: An Introduction with Applications
Statistics
ISBN:9781119256830
Author:Amos Gilat
Publisher:John Wiley & Sons Inc
Probability and Statistics for Engineering and th...
Statistics
ISBN:9781305251809
Author:Jay L. Devore
Publisher:Cengage Learning
Statistics for The Behavioral Sciences (MindTap C...
Statistics
ISBN:9781305504912
Author:Frederick J Gravetter, Larry B. Wallnau
Publisher:Cengage Learning
Elementary Statistics: Picturing the World (7th E...
Statistics
ISBN:9780134683416
Author:Ron Larson, Betsy Farber
Publisher:PEARSON
The Basic Practice of Statistics
Statistics
ISBN:9781319042578
Author:David S. Moore, William I. Notz, Michael A. Fligner
Publisher:W. H. Freeman
Introduction to the Practice of Statistics
Statistics
ISBN:9781319013387
Author:David S. Moore, George P. McCabe, Bruce A. Craig
Publisher:W. H. Freeman