
MATLAB: An Introduction with Applications
6th Edition
ISBN: 9781119256830
Author: Amos Gilat
Publisher: John Wiley & Sons Inc
expand_more
expand_more
format_list_bulleted
Related questions
Question
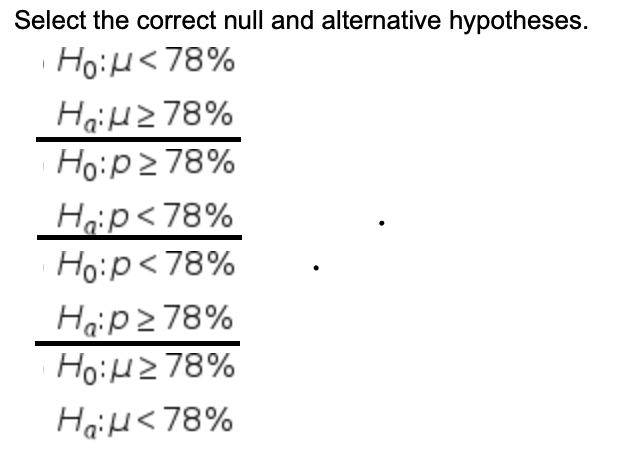

Transcribed Image Text:**Select the correct null and alternative hypotheses.**
1. \( H_0: \mu < 78\% \)
\( H_a: \mu \geq 78\% \)
2. **\( H_0: p \geq 78\% \)**
**\( H_a: p < 78\% \)**
3. \( H_0: p < 78\% \)
\( H_a: p \geq 78\% \)
4. \( H_0: \mu \geq 78\% \)
\( H_a: \mu < 78\% \)
)
**Scenario**
At the conclusion of the semester, the standard method of instruction yielded 100 grades with a mean final grade of 74.161% and a standard deviation of roughly 10.78%. A mathematics professor in the department stated that he thinks, on average, students score a 78% in the first-year algebra course; however, the mean from the sample data suggests that the true average could be lower. Answer the following questions to determine if the true population mean is lower than 78% at the 5% significance level. Since experimental methods were used in “Method 1” and “Method 2”, these grades will be ignored. *Only grades from the “Standard Method” will be considered.*](https://content.bartleby.com/qna-images/question/edd99afd-48e9-4e8a-b434-1d3cd4c035a5/091c49d5-ab0f-4b23-84d9-e6007267a96b/210xau_processed.png)
Transcribed Image Text:**Background**
In a previous lab, the results of a study conducted at a large university were presented. It compared the effectiveness of two alternative teaching methods in first-year algebra courses: “Method 1” and “Method 2”. To ensure that the selected methodology benefited all first-year students at the university, the committee conducted a randomized trial.
Three sections of the course were opened: one where a professor taught the material in a standard way, one where a professor taught using Method 1, and one where a professor taught using Method 2. Students were then randomly assigned to one of the three algebra courses but were not told that the methods of instruction varied. (Each method was assigned 100 students.) After the completion of these courses, the final grades of the students were compiled into a database. This database was used to decide which instructional method will be implemented in future classes.
**Data**
The “comma separated variable” (csv) file containing (fictitious) students’ final grades is included below. It is entitled “TestScores(2).csv” and can be downloaded. This dataset contains 300 values divided into three columns: standard method, new method 1, and new method 2. These labels correspond to the teaching strategies implemented in the scenario described above. Use descriptive statistics to characterize these data and draw conclusions. (Data: [TestScores(2).csv](#))
**Scenario**
At the conclusion of the semester, the standard method of instruction yielded 100 grades with a mean final grade of 74.161% and a standard deviation of roughly 10.78%. A mathematics professor in the department stated that he thinks, on average, students score a 78% in the first-year algebra course; however, the mean from the sample data suggests that the true average could be lower. Answer the following questions to determine if the true population mean is lower than 78% at the 5% significance level. Since experimental methods were used in “Method 1” and “Method 2”, these grades will be ignored. *Only grades from the “Standard Method” will be considered.*
Expert Solution
This question has been solved!
Explore an expertly crafted, step-by-step solution for a thorough understanding of key concepts.

This is a popular solution

Trending nowThis is a popular solution!

Step by stepSolved in 3 steps

Knowledge Booster

Similar questions
- Question 3 Y Only about 12% of all people can wiggle their ears. Is this percent lower for millionaires? Of the 369 millionaires surveyed, 33 could wiggle their ears. What can be concluded at the a = 0.05 level of significance? a. For this study, we should use Select an answer b. The null and alternative hypotheses would be: Ho: ? Select an answer ✓ H₁: ? Select an answer (please enter a decimal) (Please enter a decimal) c. The test statistic?v= d. The p-value = e. The p-value is ? a f. Based on this, we should [Select an answer the null hypothesis. g. Thus, the final conclusion is that ... (please show your answer to 3 decimal places.) (Please show your answer to 3 decimal places.) O The data suggest the population proportion is not significantly lower than 12% at a = 0.05, so there is statistically significant evidence to conclude that the population proportion of millionaires who can wiggle their ears is equal to 12%. The data suggest the population proportion is not significantly…arrow_forwardSuppose that 70% of all Americans agree that a candidate is not trustworthy. A survey finds the 116 out of 200 agree that a candidate is not trustworthy. How likely is the result above to happen, if the sample is representative of the population? Choose the best answer. It is very likely It is somewhat likely It is unlikely It is very unlikelyarrow_forwardK Census data for a certain county show that 17% of the adult residents are Hispanic. Suppose 74 people are called for jury duty and only 10 of them are Hispanic. Does this apparent underrepresentation of Hispanics call into question the fairness of the jury selection system? Explain.. Write appropriate hypotheses. Ho: p= 17% HA: P < 17% The test statistic is z = - .80 (Round to two decimal places as needed.) The P-value is. (Round to three decimal places as needed.) Carrow_forward
- In a recent polI, 480 people were asked if they liked dogs, and 44% said they did. Find the margin of error of this poll, at the 90% confidence level. Give your answer to three decimalsarrow_forwardA psychologist specializing counseling claims that, among all married couples, the proportion p for whom her communication program can prevent divorce 79% . In a random sample of 240 married couples who completed her program, 174 of them stayed together. Based on this sample, can we reject the psychologist's claim at the 0.1 level of significance The null hypothesis: H0: ___ The alternative hypothesis: H1: ___ The type of test statistic: (Choose one) ___ The value of the test statistic: (Round to at least three decimal places.) ______ The p-value: (Round to at least three decimal places.) _____ Can we reject psychologist’s claim that the Proportion of married couples for whom her Program can prevent divorce is a least 79%? Yes ____ or NO____arrow_forwardIf one rejects the null hypothesis at the 5% level, then there is a 5% chance that you made the wrong decision. True /Falsearrow_forward
- Question 3 a) A random sample of 800 voters in a particular city found 240 who voted yes on State Question 813. Find a 98.5% confidence interval for the true percent of voters in this city who voted yes on proposition 200.Enter the lower endpoint of the interval in the first blank and the upper endpoint in the second blank. Enter your answer as a decimal rounded to four decimal places. For example, 0.1234 would be the correct format. You must use critical values from the tablesarrow_forwardIn a recent poll, 490 people were asked if they liked dogs, and 8% said they did. Find the margin of error of this poll, at the 99% confidence level. Give your answer to three decimals Submit Questionarrow_forward
arrow_back_ios
arrow_forward_ios
Recommended textbooks for you
- MATLAB: An Introduction with ApplicationsStatisticsISBN:9781119256830Author:Amos GilatPublisher:John Wiley & Sons Inc
 Probability and Statistics for Engineering and th...StatisticsISBN:9781305251809Author:Jay L. DevorePublisher:Cengage Learning
 Statistics for The Behavioral Sciences (MindTap C...StatisticsISBN:9781305504912Author:Frederick J Gravetter, Larry B. WallnauPublisher:Cengage Learning
  Elementary Statistics: Picturing the World (7th E...StatisticsISBN:9780134683416Author:Ron Larson, Betsy FarberPublisher:PEARSON
 The Basic Practice of StatisticsStatisticsISBN:9781319042578Author:David S. Moore, William I. Notz, Michael A. FlignerPublisher:W. H. Freeman
 Introduction to the Practice of StatisticsStatisticsISBN:9781319013387Author:David S. Moore, George P. McCabe, Bruce A. CraigPublisher:W. H. Freeman
MATLAB: An Introduction with Applications
Statistics
ISBN:9781119256830
Author:Amos Gilat
Publisher:John Wiley & Sons Inc
Probability and Statistics for Engineering and th...
Statistics
ISBN:9781305251809
Author:Jay L. Devore
Publisher:Cengage Learning
Statistics for The Behavioral Sciences (MindTap C...
Statistics
ISBN:9781305504912
Author:Frederick J Gravetter, Larry B. Wallnau
Publisher:Cengage Learning
Elementary Statistics: Picturing the World (7th E...
Statistics
ISBN:9780134683416
Author:Ron Larson, Betsy Farber
Publisher:PEARSON
The Basic Practice of Statistics
Statistics
ISBN:9781319042578
Author:David S. Moore, William I. Notz, Michael A. Fligner
Publisher:W. H. Freeman
Introduction to the Practice of Statistics
Statistics
ISBN:9781319013387
Author:David S. Moore, George P. McCabe, Bruce A. Craig
Publisher:W. H. Freeman