
MATLAB: An Introduction with Applications
6th Edition
ISBN: 9781119256830
Author: Amos Gilat
Publisher: John Wiley & Sons Inc
expand_more
expand_more
format_list_bulleted
Related questions
Question
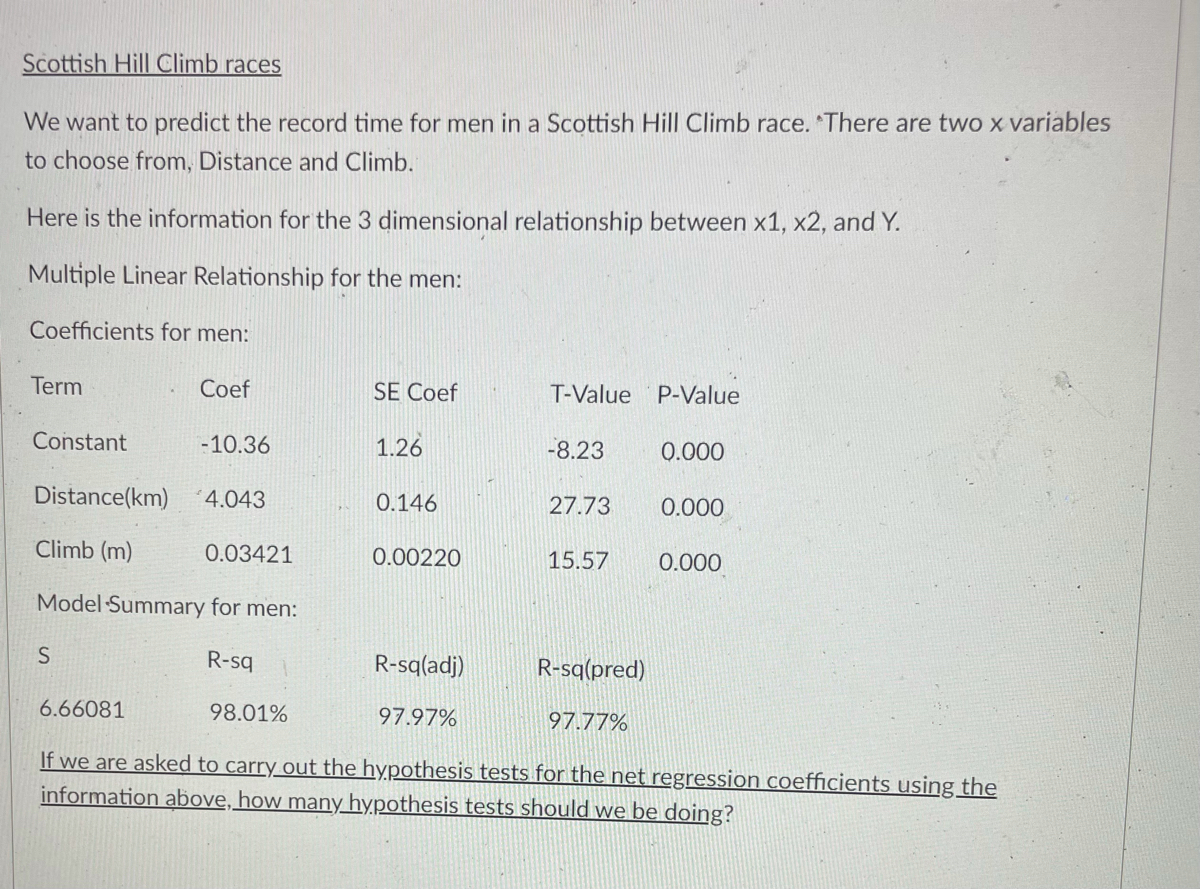

Transcribed Image Text:Scottish Hill Climb races
We want to predict the record time for men in a Scottish Hill Climb race. There are two x variables
to choose from, Distance and Climb.
Here is the information for the 3 dimensional relationship between x1, x2, and Y.
Multiple Linear Relationship for the men:
Coefficients for men:
Term
Coef
SE Coef
T-Value P-Value
Constant
-10.36
1.26
-8.23
0.000
Distance(km)
4.043
0.146
27.73
0.000
Climb (m)
0.03421
0.00220
15.57
0.000
Model Summary for men:
R-sq
R-sq(adj)
R-sq(pred)
6.66081
98.01%
97.97%
97.77%
If we are asked to carry out the hypothesis tests for the net regression coefficients using the
information above, how many hypothesis tests should we be doing?
Expert Solution
This question has been solved!
Explore an expertly crafted, step-by-step solution for a thorough understanding of key concepts.

This is a popular solution

Trending nowThis is a popular solution!

Step by stepSolved in 3 steps

Knowledge Booster

Similar questions
- which of the following is a correct interpretation of the intercept?arrow_forwardDirections: Identify the Independent and Dependant VariablesThe amount of money, m, earned if t raffle tickets are soldm is ?t is ?arrow_forward. Hourly Wage A manuscript translator charges astarting fee of $50 plus $2.50 per page translated. Writea linear equation for the amount A earned for translatingp pages.arrow_forward
- You are given the dollar value of a product in 2016 and the rate at which the value of the product is expected to change during the next 5 years. Use this information to write a linear equation that gives the dollar value V of the product in terms of the year t. (Let t=16 represents 2016)arrow_forwardThe number of miles a car can be driven is proportional to the number of gallons of gasoline that uses the car can be driven 14 miles per 1/2 gallon of gasoline used the cost of 5 gallons of gasoline is $20 right an equation to show the relationship between the cost and the gallons of gasolinearrow_forwardAviation The Federal Aviation Administration tracks airline delays for airports around the country. During the first half of 2007, the flights delayed at Dallas-Fort Worth Airport averaged 4,500 per month. Use this information to write an equation in slope-intercept form that could be used to predict the total number of delays throughout the year. Let x equal the month of the year and y equal the cumulative delays.arrow_forward
- Please explain which grapg uses rate of change formula and which uses slope formula.arrow_forwardThe percent of defects is the x-coordinate, while the percent of new machines is the y-coordinate. So, the table of values corresponds to the points (25,32), (20,40), (15,50), (10,65), (5,70), (0,85). Question Using the linear relationship graphed above, estimate the percent of new machines if there is 12% defects in the shoes at various production facilities. Provide your answer below: _____arrow_forward
arrow_back_ios
arrow_forward_ios
Recommended textbooks for you
- MATLAB: An Introduction with ApplicationsStatisticsISBN:9781119256830Author:Amos GilatPublisher:John Wiley & Sons Inc
 Probability and Statistics for Engineering and th...StatisticsISBN:9781305251809Author:Jay L. DevorePublisher:Cengage Learning
 Statistics for The Behavioral Sciences (MindTap C...StatisticsISBN:9781305504912Author:Frederick J Gravetter, Larry B. WallnauPublisher:Cengage Learning
  Elementary Statistics: Picturing the World (7th E...StatisticsISBN:9780134683416Author:Ron Larson, Betsy FarberPublisher:PEARSON
 The Basic Practice of StatisticsStatisticsISBN:9781319042578Author:David S. Moore, William I. Notz, Michael A. FlignerPublisher:W. H. Freeman
 Introduction to the Practice of StatisticsStatisticsISBN:9781319013387Author:David S. Moore, George P. McCabe, Bruce A. CraigPublisher:W. H. Freeman
MATLAB: An Introduction with Applications
Statistics
ISBN:9781119256830
Author:Amos Gilat
Publisher:John Wiley & Sons Inc
Probability and Statistics for Engineering and th...
Statistics
ISBN:9781305251809
Author:Jay L. Devore
Publisher:Cengage Learning
Statistics for The Behavioral Sciences (MindTap C...
Statistics
ISBN:9781305504912
Author:Frederick J Gravetter, Larry B. Wallnau
Publisher:Cengage Learning
Elementary Statistics: Picturing the World (7th E...
Statistics
ISBN:9780134683416
Author:Ron Larson, Betsy Farber
Publisher:PEARSON
The Basic Practice of Statistics
Statistics
ISBN:9781319042578
Author:David S. Moore, William I. Notz, Michael A. Fligner
Publisher:W. H. Freeman
Introduction to the Practice of Statistics
Statistics
ISBN:9781319013387
Author:David S. Moore, George P. McCabe, Bruce A. Craig
Publisher:W. H. Freeman