MATLAB: An Introduction with Applications
6th Edition
ISBN: 9781119256830
Author: Amos Gilat
Publisher: John Wiley & Sons Inc
expand_more
expand_more
format_list_bulleted
Question

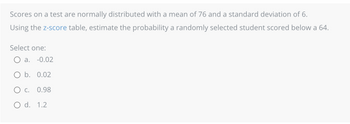
Transcribed Image Text:Scores on a test are normally distributed with a mean of 76 and a standard deviation of 6.
Using the z-score table, estimate the probability a randomly selected student scored below a 64.
Select one:
O a. -0.02
O b. 0.02
OC. 0.98
O d. 1.2
Expert Solution
This question has been solved!
Explore an expertly crafted, step-by-step solution for a thorough understanding of key concepts.
Step by stepSolved in 3 steps with 3 images

Knowledge Booster
Similar questions
- Use the normal distribution of fish lengths for which the mean is 8 inches and the standard deviation is 2 inches. Assume the variable x is normally distributed. left parenthesis a right parenthesis If 400 fish are randomly selected, how many would you expect to be shorter than 6 inches?arrow_forwardFind t0.69t0.69 for TT distribution with 8282 degrees of freedom. t0.69=t0.69= (Round the answer to 3 decimal places)arrow_forwardIQ scores are normally distributed with mean = 100 and standard deviation = 16. What IQ score does the letter A represent in the diagram below? Enter your answer as a whole number with no units. Add your answer 68% 95% 99.7% A B C D E F Garrow_forward
- Find the area of the shaded region. The graph to the right depicts IQ scores of adults, and those scores are normally distributed with a mean of 100 and a standard deviation of 15. The area of the shaded region is (Round to four decimal places as needed.)arrow_forwardFill in the blanks: Suppose you obtain a random sample of 400 apps from the population of all Google apps. Describe the distribution of the sample proportion. The standard deviation of the sampling distribution is places as needed.) (Round to three decimalarrow_forwardThe frequency distribution was obtained using a class width of 0.5 for data on cigarette tax rates. Use the frequency distribution to approximate the population mean and population standard deviation. Compare these results to the actual mean u = $1.727 and standard deviation o = S1.041. E Click the icon to view the frequency distribution for the tax rates. Frequency distribution of cigarette tax rates The population mean is $ Tax Rate 0.00-0.49 0.50-0.99 1.00-1,49 1.50-1.99 2.00-2.49 2.50-2.99 3.00-3.49 3.50-3.99 Frequency D (Round to three decimal places as needed.) 5 15 The population standard deviation is S (Round to three decimal places as needed.) Compare these results to the values found using the actual data. O A. The grouped mean is slightly larger, while the grouped standard deviation is slightly smaller. O B. The grouped values are both slightly larger. O C. The grouped values are both slightly smaller. O D. The grouped mean is slightly smaller, while the grouped standard…arrow_forward
- Please helparrow_forwardFind the z-score for which 85% of the distribution's area lies to its right. O-1.96 O-2.04 O-1.04 O-0.39arrow_forwardIQ scores are normally distributed with a mean of 100 and standard deviation 16. Calculate the z-score for an IQ of 76. Include one decimal place in your answer. Add your answerarrow_forward
- Find the margin of error for the given values of c, s, and n. c= 0.80, s = 2.6, n= 10 Click the icon to view the t-distribution table. The margin of error is (Round to one decimal place as needed.)arrow_forwardFind SAT Quartiles. SAT scores are reported on a scale from 600 to 2400. The mean is 1498 and the standard deviation is 316. The quartiles of any distribution are the values with cumulative proportions 0.25, and 0.75. What are the quartiles of the distribution of SAT scores?arrow_forwardA distribution of values is normal with a mean of 190 and a standard deviation of 4.Find the interval containing the middle-most 30% of scores: Enter your answer using interval notation. Example: (2.1,5.6)arrow_forward
arrow_back_ios
SEE MORE QUESTIONS
arrow_forward_ios
Recommended textbooks for you
 MATLAB: An Introduction with ApplicationsStatisticsISBN:9781119256830Author:Amos GilatPublisher:John Wiley & Sons Inc
 Probability and Statistics for Engineering and th...StatisticsISBN:9781305251809Author:Jay L. DevorePublisher:Cengage Learning
 Statistics for The Behavioral Sciences (MindTap C...StatisticsISBN:9781305504912Author:Frederick J Gravetter, Larry B. WallnauPublisher:Cengage Learning
 Elementary Statistics: Picturing the World (7th E...StatisticsISBN:9780134683416Author:Ron Larson, Betsy FarberPublisher:PEARSON
 The Basic Practice of StatisticsStatisticsISBN:9781319042578Author:David S. Moore, William I. Notz, Michael A. FlignerPublisher:W. H. Freeman
 Introduction to the Practice of StatisticsStatisticsISBN:9781319013387Author:David S. Moore, George P. McCabe, Bruce A. CraigPublisher:W. H. Freeman

MATLAB: An Introduction with Applications
Statistics
ISBN:9781119256830
Author:Amos Gilat
Publisher:John Wiley & Sons Inc

Probability and Statistics for Engineering and th...
Statistics
ISBN:9781305251809
Author:Jay L. Devore
Publisher:Cengage Learning

Statistics for The Behavioral Sciences (MindTap C...
Statistics
ISBN:9781305504912
Author:Frederick J Gravetter, Larry B. Wallnau
Publisher:Cengage Learning

Elementary Statistics: Picturing the World (7th E...
Statistics
ISBN:9780134683416
Author:Ron Larson, Betsy Farber
Publisher:PEARSON

The Basic Practice of Statistics
Statistics
ISBN:9781319042578
Author:David S. Moore, William I. Notz, Michael A. Fligner
Publisher:W. H. Freeman

Introduction to the Practice of Statistics
Statistics
ISBN:9781319013387
Author:David S. Moore, George P. McCabe, Bruce A. Craig
Publisher:W. H. Freeman