A First Course in Probability (10th Edition)
10th Edition
ISBN: 9780134753119
Author: Sheldon Ross
Publisher: PEARSON
expand_more
expand_more
format_list_bulleted
Question

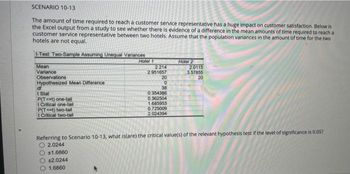
Transcribed Image Text:SCENARIO 10-13
The amount of time required to reach a customer service representative has a huge impact on customer satisfaction. Below is
the Excel output from a study to see whether there is evidence of a difference in the mean amounts of time required to reach a
customer service representative between two hotels. Assume that the population variances in the amount of time for the two
hotels are not equal.
t-Test: Two-Sample Assuming Unequal Variances
Mean
Variance
Observations
Hotel 1
Hotel 2
2.214
2.951657
20
2.0115
3.57855
20
Hypothesized Mean Difference
0
df
38
t Stat
0.354386
0.362504
1.685953
0.725009
2.024394
P(T<t) one-tail
t Critical one-tail
P(Tt) two-tail
t Critical two-tail
Referring to Scenario 10-13, what is(are) the critical value(s) of the relevant hypothesis test if the level of significance is 0.05?
O2.0244
±1.6860
±2.0244
1.6860.
SAVE
AI-Generated Solution
info
AI-generated content may present inaccurate or offensive content that does not represent bartleby’s views.
Unlock instant AI solutions
Tap the button
to generate a solution
to generate a solution
Click the button to generate
a solution
a solution
Knowledge Booster
Similar questions
- A brokerage firm wants to conduct a study to see if there is a linear relationship between the size of an account and the number of trades conducted each year. What would be the most appropriate procedure to use to analyze data to answer this question? Only choose a test that handles multiple comparisons if such a test is needed. O ANOVA (Analysis of Variance) O Regression Test of Slope or Correlation O Test for a Difference of Proportions O Chi-square test of association O Test for a Difference of Meansarrow_forwardAn engineer designed a valve that will regulate water pressure on an automobile engine. The engineer designed the valve such that it would produce a mean pressure of 5.5 pounds/square inch. It is believed that the valve performs above the specifications. The valve was tested on 24 engines and the mean pressure was 5.7 pounds/square inch with a variance of 0.49. A level of significance of 0.01 will be used. Assume the population distribution is approximately normal. Make the decision to reject or fail to reject the null hypothesis.arrow_forwardChoose the appropriate statistical test. When computing, be sure to round each answer as indicated. A dentist wonders if depression affects ratings of tooth pain. In the general population, using a scale of 1-10 with higher values indicating more pain, the average pain rating for patients with toothaches is 6.8. A sample of 30 patients that show high levels of depression have an average pain rating of 7.1 (variance 0.8). What should the dentist determine? 1. Calculate the estimated standard error. (round to 3 decimals). [st.error] 2. What is thet-obtained? (round to 3 decimals). 3. What is the t-cv? (exact value) 4. What is your conclusion? Only type "Reject" or Retain"arrow_forward
- Which of the following conclusions is correct for these test results? > bartlett.test(len~river, data=rivers) Bartlett test of homogeneity of variances data: len by river Bartlett's K-squared = 0.61394, df = 4, p-value = 0.5226 %3D Hint* the first line of code should tell you the type of test you are dealing with. There is NO significant difference in variances among the rivers. There is a significant difference in variances among the rivers. There is NO significant difference in means among the rivers.arrow_forwardExplain the circumstances under which we would need to pool the variance for an independent samples t-testarrow_forwardAn intercity bus company is attempting to improve the reliability of its service. One manager claims that the variability (i.e., standard deviation) in arrivals from the posted schedule at the central bus depot is approximately 3 minutes. Another manager disagrees, suspecting that the spread in times of arrival is different. Using variance, what is the population parameter under consideration? What hypotheses should the managers test in this situation?arrow_forward
- A researcher wants to measure average cardiovascular health of university students and compare those scores to the average scores in the general population. Assuming that population variance is known, what statistical test is most appropriate for this study? independent-samples t-test single-sample t-test z-test for sample mean related-samples t-testarrow_forwardIn a study performed on comfort food eating during times of stress, it was found that mean rated comfort food consumption level (on a scale from 1-20) for a group of students undertaking their exam period was 14. In comparison, a group of students who were not undertaking exams or examination preparation had a mean rated comfort food consumption level of 10. The pooled estimate of the population variance was 64. What is the estimated effect size (d) of the study? 0.80 0.06 0.50 2.00arrow_forwardThe article cited in Exercise 19 provides measures of electrical conductivity (in uS/cm). The results are presented in the following table. Sample Size 49 Location Mean SD Upstream 463 208 Midstream 363 98 31 Downstream 647 878 30 Can a one-way analysis of variance be used to determine whether conductivity varies with location? Or is one of the necessary assumptions violated? Explain.arrow_forward
arrow_back_ios
arrow_forward_ios
Recommended textbooks for you
 A First Course in Probability (10th Edition)ProbabilityISBN:9780134753119Author:Sheldon RossPublisher:PEARSON

A First Course in Probability (10th Edition)
Probability
ISBN:9780134753119
Author:Sheldon Ross
Publisher:PEARSON
