
MATLAB: An Introduction with Applications
6th Edition
ISBN: 9781119256830
Author: Amos Gilat
Publisher: John Wiley & Sons Inc
expand_more
expand_more
format_list_bulleted
Related questions
Question
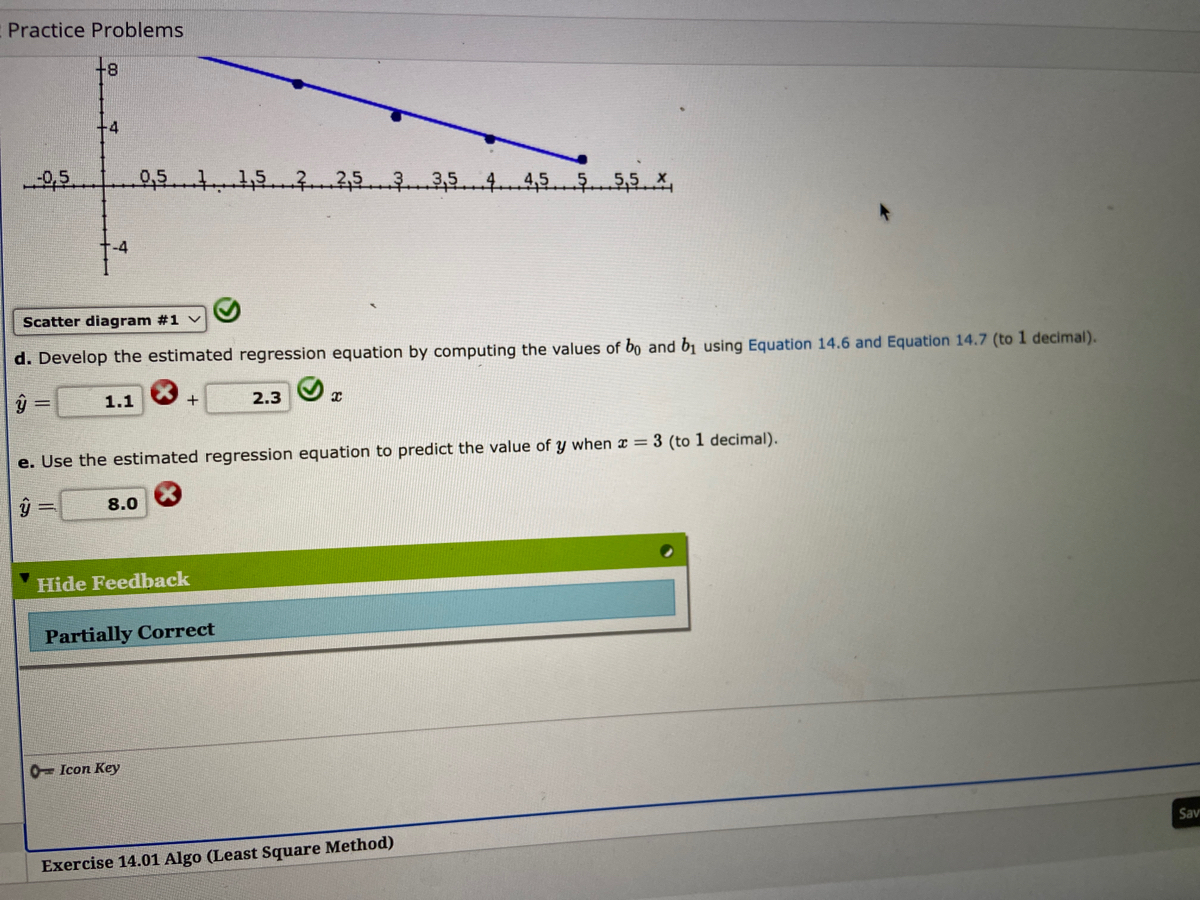

Transcribed Image Text:Practice Problems
+8
+4
0,5
0,5 1 1,5 22,5
5 4 4,5 5 5,5 x
Scatter diagram #1 v
d. Develop the estimated regression equation by computing the values of bo and by using Equation 14.6 and Equation 14.7 (to 1 decimal).
ý
=
1.1
+
2.3
I
e. Use the estimated regression equation to predict the value of y when x = 3 (to 1 decimal).
ŷ
8.0
Hide Feedback
Partially Correct
O Icon Key
Sav
Exercise 14.01 Algo (Least Square Method)

Transcribed Image Text:- 14.2 Practice Problems
●
♥ Given are five observations for two variables, and y.
Xi
Yi
a. Which of the following scatter diagrams accurately represents the data?
1.
+16
+12
+8
●
-4
3 3,5
4,5 5 5,5 x
›
>
●00
2.
-0,5
-4
+16
+12
+-8
0,5
1
3
2 3 4 5
7
5
10
13
Expert Solution
This question has been solved!
Explore an expertly crafted, step-by-step solution for a thorough understanding of key concepts.

This is a popular solution

Trending nowThis is a popular solution!

Step by stepSolved in 4 steps with 3 images

Knowledge Booster

Similar questions
- Consider the following regression equation: y = -5.3 + 8.8x.What does 8.8 depict in the regression equation above? a. None of the options. b. The direction of the line. c. The point where x = 0. d. The y-intercept.arrow_forward# The table contains the state population and the number of licensed drivers in the state (both in millions) for the states with population under 1 million in 2014. The regression model for this data is y 0.7x where x is the state population (in millions) and y is the number of State licensed drivers (in millions) in the state. (A) Draw a scatter plot of the data and a graph of the model on the same axes. Choose the correct graph below OC Diverse) 07 Se pun CHANG The estimated population of state Jin 2014 is (Type a whole number Round to the nearest thousand as needed) 0.5 (8) If the population of state H in 2014 was about 1.6 million, use the model to estimate the number of licensed drivers in state H in 2014 The estimated number of licensed drivers in state H in 2014 is (Type a whole number. Round to the nearest thousand as needed) (C) If the number of licensed drivers in state J in 2014 was about 1,043.000, use the model to estimate the population of state Jin 2014 AOCDEFO А С OD…arrow_forwardFind the equation of the regression line for the given data. Then construct a scatter plot of the data and draw the regression line. (The pair of variables have a significant correlation.) Then use the regression equation to predict the value of y for each of the given x-values, if meaningful. The number of hours 6 students spent for a test and their scores on that test are shown below. Hours spent studying, x 0 Test score, y 38 Find the regression equation. 2 3 3 4 6 45 50 49 61 68 0 (a) x = 2 hours (c) x = 15 hours (b)x=4.5 hours (d) x=2.5 hours y = X + (Round the slope to three decimal places as needed. Round the y-intercept to two decimal places as needed.)arrow_forward
- Find the slope (b1) for the regression equation for the following values. Round to 3 decimal places. Define Variables xi yi 33 180 25 170 50 200 65 201 57 160 27 165arrow_forwardFind the slope (b1) for the regression equation for the following values. Round to 3 decimal places. Define Variables xi yi 33 180 25 170 50 200 65 186 57 160 27 165arrow_forwardFind the regression equation, letting the first variable be the predictor (x) variable. Using the listed actress/actor ages in various years, find the best predicted age of the Best Actor winner given that the age of the Best Actress winner that year is 59 years. Is the result within 5 years of the actual Best Actor winner, whose age was 39 years? a. Find the equation of the regression line. y= (Round the y-intercept to one decimal place as needed. Round the slope to three decimal places as needed.) b. The best predicted age of the Best Actor winner given that the age of the Best Actress winner that year is 59 years is years old. (Round to the nearest whole number as needed.)arrow_forward
- Give the equation of the regression line: -913.2969+0.4808years(y) a) Plug an actual x value into the equation and discuss the difference between the real y and the predicted yb) Discuss the domain of your datac) Include the scatterplot with line of best fitarrow_forwardA set of X and Y scores has SSX = 15, SSY = 24, and SP = 60. The regression equation for these scores will have a slope constant of ______. a. 6 b. 5 c. 3 d. 4arrow_forwardFind the regression equation, letting the first variable be the predictor (x) variable. Using the listed actress/actor ages in various years, find the best predicted age of the Best Actor winner given that the age of the Best Actress winner that year is 29 years. Is the result within 5 years of the actual Best Actor winner, whose age was 40 years? a. Find the equation of the regression line. y= (Round the y-intercept to one decimal place as needed. Round the slope to three decimal places as needed.)arrow_forward
- please help me answer this for my data analysis classarrow_forwardConsider the following regression equation: y = -3.9 + 7.2x What does 7.2 depict in the regression equation above? a) The direction of the line. b) The y-intercept. c) The point where x = 0. d) The y when x = 7.2.arrow_forwardUse the computer output to estimate the intercept BO and the slope B1.The regression equation is Y=795 - 3.25X Predictor Coef SE Coef T P Constant 795.449 86.46 9.20 0.000 X -3.252 1.066 -3.05 0.006 Intercept B 0:Slope B 1:arrow_forward
arrow_back_ios
SEE MORE QUESTIONS
arrow_forward_ios
Recommended textbooks for you
- MATLAB: An Introduction with ApplicationsStatisticsISBN:9781119256830Author:Amos GilatPublisher:John Wiley & Sons Inc
 Probability and Statistics for Engineering and th...StatisticsISBN:9781305251809Author:Jay L. DevorePublisher:Cengage Learning
 Statistics for The Behavioral Sciences (MindTap C...StatisticsISBN:9781305504912Author:Frederick J Gravetter, Larry B. WallnauPublisher:Cengage Learning
  Elementary Statistics: Picturing the World (7th E...StatisticsISBN:9780134683416Author:Ron Larson, Betsy FarberPublisher:PEARSON
 The Basic Practice of StatisticsStatisticsISBN:9781319042578Author:David S. Moore, William I. Notz, Michael A. FlignerPublisher:W. H. Freeman
 Introduction to the Practice of StatisticsStatisticsISBN:9781319013387Author:David S. Moore, George P. McCabe, Bruce A. CraigPublisher:W. H. Freeman
MATLAB: An Introduction with Applications
Statistics
ISBN:9781119256830
Author:Amos Gilat
Publisher:John Wiley & Sons Inc
Probability and Statistics for Engineering and th...
Statistics
ISBN:9781305251809
Author:Jay L. Devore
Publisher:Cengage Learning
Statistics for The Behavioral Sciences (MindTap C...
Statistics
ISBN:9781305504912
Author:Frederick J Gravetter, Larry B. Wallnau
Publisher:Cengage Learning
Elementary Statistics: Picturing the World (7th E...
Statistics
ISBN:9780134683416
Author:Ron Larson, Betsy Farber
Publisher:PEARSON
The Basic Practice of Statistics
Statistics
ISBN:9781319042578
Author:David S. Moore, William I. Notz, Michael A. Fligner
Publisher:W. H. Freeman
Introduction to the Practice of Statistics
Statistics
ISBN:9781319013387
Author:David S. Moore, George P. McCabe, Bruce A. Craig
Publisher:W. H. Freeman