
MATLAB: An Introduction with Applications
6th Edition
ISBN: 9781119256830
Author: Amos Gilat
Publisher: John Wiley & Sons Inc
expand_more
expand_more
format_list_bulleted
Related questions
Question
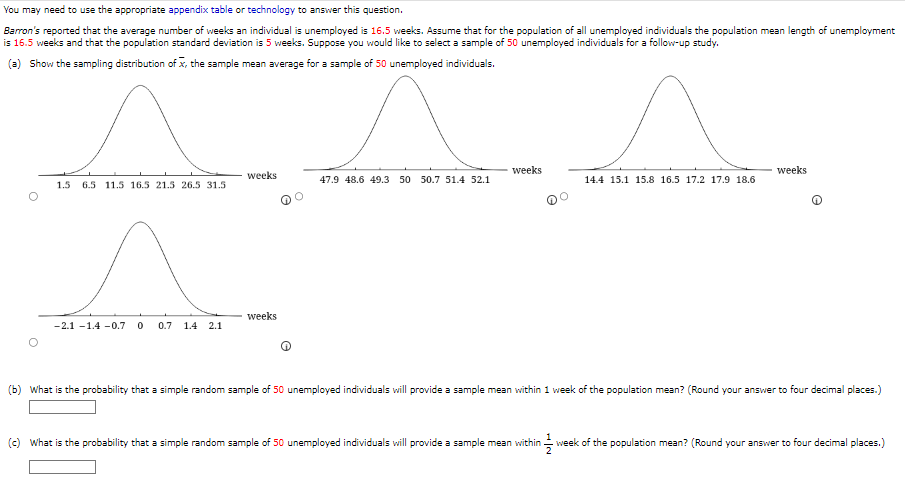

Transcribed Image Text:You may need to use the appropriate appendix table or technology to answer this question.
Barron's reported that the average number of weeks an individual is unemployed is 16.5 weeks. Assume that for the population of all unemployed individuals the population mean length of unemployment
is 16.5 weeks and that the population standard deviation is 5 weeks. Suppose you would like to select a sample of 50 unemployed individuals for a follow-up study.
(a) Show the sampling distribution of x, the sample mean average for a sample of 50 unemployed individuals.
^
1.5 6.5 11.5 16.5 21.5 26.5 31.5
A
-2.1-1.4 -0.7 0 0.7 1.4 2.1
weeks
weeks
47.9 48.6 49.3 50 50.7 51.4 52.1
weeks
14.4 15.1 15.8 16.5 17.2 17.9 18.6
weeks
(b) What is the probability that a simple random sample of 50 unemployed individuals will provide a sample mean within 1 week of the population mean? (Round your answer to four decimal places.)
(c) What is the probability that a simple random sample of 50 unemployed individuals will provide a sample mean within -week of the population mean? (Round your answer to four decimal places.)
Expert Solution
This question has been solved!
Explore an expertly crafted, step-by-step solution for a thorough understanding of key concepts.

Step by stepSolved in 2 steps with 1 images

Knowledge Booster

Similar questions
- A clinical microbiology laboratory compared the frequency of isolation of DNA hybridization probe to a culture method for the sexually transmitted bacterium Neisseria gonorrhaeae. The frequency of isolation from clinical specimens was historically 10%. The lab ran 100 split samples, and the results are presented in the table below. Table. Comparison of the Distribution of Negative and Positive Results for the DNA Probe and Culture Methods. Culture Results DNA Probe Results Positive (D) Negative (D-) Positive (T) 8 4 Negative (T-) 2 92 What is the sensitivity of the test? I choose c wouldn't the sensitivity been 0.02 ? or my calculations is wrong A. 0.88 or 88% B. 0.8 or 80% C. 0.02 or 2% D. 0.81 or 81%arrow_forwardTest statistic and p valuearrow_forwardThe t distribution is applicable when Group of answer choices the population has a mean of less than 30 the sample standard deviation is used to estimate the population standard deviation the variance of the population is known the standard deviation of the population is knowarrow_forward
- Distribution A x frequency 0 20 1 2 2 3 3 2 4 4 5 18 6 5 7 4 8 6 9 6 Distribution B x frequency 0 7 1 6 2 6 3 7 4 8 5 6 6 7 7 9 8 8 9 6 Both samples are the last digits of recorded weights of people. One of the samples came from measured weights, whereas the other sample resulted from asking people what they weigh. Identify which distribution came from which sample. Explain how you came to that conclusion. Notice that you can make a conclusion about the nature of the data by simply examining the distributions. Next, construct an “ideal” distribution of last digits x that would result from 100,000 people who were actually weighed. Estimate the mean and standard deviation of the last digits x in the ideal distribution. Finally, explicitly agree or disagree with the posts of at least 2 of your peers, and explain why you agree or…arrow_forwardSUBPART, need help solving the problem. Label each partarrow_forwardThe Pearson s product moment correlation coefficient (r ) is derived by calculating the ratio of the _____________. between treatments variability / variability in X and Y separately variability in X and Y separately / the covariance of X and Y together between treatments variability / the total variability in the dataset the covariance of X and Y together / variability of X and Y separatelyarrow_forward
- Random Variable X Directions: Compute the expected value, variance, and standard deviation for random variable X whose probability table is given below: Possible Outcome 8 10 12 14 0.1 0.4 0.4 0.1 Probability Probability Table for X 1. The Expected Value of X is E(X) 2. The Variance of X is Var(X) 3. The Standard Deviation of X is Std(X) Random Variable Y Directions: Compute the expected value, variance, and standard deviation for random variable Y whose probability table is given below: Possible Outcome 8 10 12 14 Probability 0.3 0.2 0.2 0.3 Probability Table for Y 1. The Expected Value of Y is E(Y) 2. The Variance of Y is Var(Y) 3. The Standard Deviation of Y is Std(Y)arrow_forwardUsing the Binomial distribution, If n = 9 and p = 0.2, then calculate the following P(x 3) D [three decimal accuracy] Submit Questionarrow_forwardt Test for TWO DEPENDENT (Related) SAMPLES (Show all work) A manufacturer of a gas additive claims that it improves gas mileage. A random sample of 40 drivers tests this claim by determining their gas mileage for a full tank of gas that contains the additive (X1) and for a full tank of gas that does not contain the additive (X2). The sample mean difference D-Bar equals 2.12 miles (in favor of the additive) and the estimated standard error equals 1.50 miles. Test the Null Hypothesis with t, using the .05 Level of significance and construct a 95 percent confidence interval (whether you reject OR retain the Null Hypothesis)arrow_forward
- The ANOVA F-test is always a left tailed test two tailed test right tailed test What distribution does the test use? χ2 t z Farrow_forwardInformation about a sample is given assume that the sampling distribution is symmetric and bell shaped. X=52 and the standard error is 5arrow_forwarda) Mean b) Binomial Distributionarrow_forward
arrow_back_ios
arrow_forward_ios
Recommended textbooks for you
- MATLAB: An Introduction with ApplicationsStatisticsISBN:9781119256830Author:Amos GilatPublisher:John Wiley & Sons Inc
 Probability and Statistics for Engineering and th...StatisticsISBN:9781305251809Author:Jay L. DevorePublisher:Cengage Learning
 Statistics for The Behavioral Sciences (MindTap C...StatisticsISBN:9781305504912Author:Frederick J Gravetter, Larry B. WallnauPublisher:Cengage Learning
  Elementary Statistics: Picturing the World (7th E...StatisticsISBN:9780134683416Author:Ron Larson, Betsy FarberPublisher:PEARSON
 The Basic Practice of StatisticsStatisticsISBN:9781319042578Author:David S. Moore, William I. Notz, Michael A. FlignerPublisher:W. H. Freeman
 Introduction to the Practice of StatisticsStatisticsISBN:9781319013387Author:David S. Moore, George P. McCabe, Bruce A. CraigPublisher:W. H. Freeman
MATLAB: An Introduction with Applications
Statistics
ISBN:9781119256830
Author:Amos Gilat
Publisher:John Wiley & Sons Inc
Probability and Statistics for Engineering and th...
Statistics
ISBN:9781305251809
Author:Jay L. Devore
Publisher:Cengage Learning
Statistics for The Behavioral Sciences (MindTap C...
Statistics
ISBN:9781305504912
Author:Frederick J Gravetter, Larry B. Wallnau
Publisher:Cengage Learning
Elementary Statistics: Picturing the World (7th E...
Statistics
ISBN:9780134683416
Author:Ron Larson, Betsy Farber
Publisher:PEARSON
The Basic Practice of Statistics
Statistics
ISBN:9781319042578
Author:David S. Moore, William I. Notz, Michael A. Fligner
Publisher:W. H. Freeman
Introduction to the Practice of Statistics
Statistics
ISBN:9781319013387
Author:David S. Moore, George P. McCabe, Bruce A. Craig
Publisher:W. H. Freeman