
MATLAB: An Introduction with Applications
6th Edition
ISBN: 9781119256830
Author: Amos Gilat
Publisher: John Wiley & Sons Inc
expand_more
expand_more
format_list_bulleted
Related questions
Question
REFER TO TABLE FOR QUESTION PLS THX
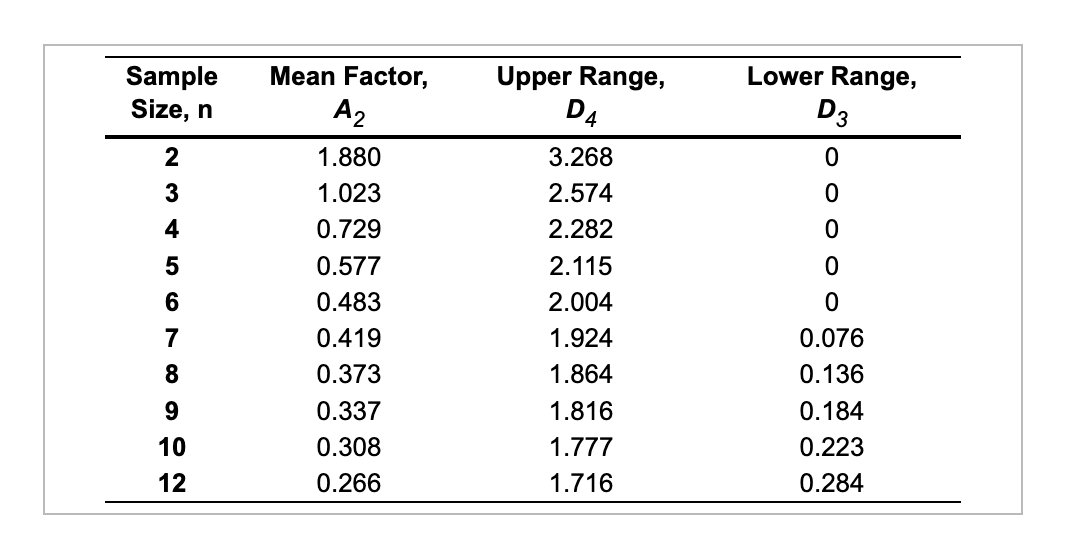

Transcribed Image Text:Sample
Size, n
2
3
4
5
6
7
89 10 12
Mean Factor,
A2
1.880
1.023
0.729
0.577
0.483
0.419
0.373
0.337
0.308
0.266
Upper Range,
D4
3.268
2.574
2.282
2.115
2.004
1.924
1.864
1.816
1.777
1.716
Lower Range,
D3
0
0
0
0
0
0.076
0.136
0.184
0.223
0.284

Transcribed Image Text:Sampling 4 pieces of precision-cut wire (to be used in computer assembly) every hour for the past 24 hours has produced the following results:
Hour X R Hour X
Hour
7
8
3.31"
2.79
X
R
3.15" 0.48" 13 3.01" 0.90" 19
2.65 1.08 14 2.73 1.26 20
2.92 0.71 15 3.12 1.11 21
2.75 1.28 16 2.74 0.50 22
2.73 1.12 17 2.96 1.48 23
2.97 0.40 18 2.84
24
2.55
9
10
11
12
3.18
2.84
1.34
2.54
Hour
1
2
3
4
5
6
X
3.25"
3.00
3.22
3.49
3.17
2.96
R
0.76"
1.13
1.43
1.21
1.12
0.32
R
1.56"
1.09
1.08
0.46
1.58
0.92
Based on the sampling done, the control limits for 3-sigma x chart are (round all intermediate calculations to three decimal places before proceeding with further calculations):
Upper Control Limit (UCL) = inches (round your response to three decimal places).
Expert Solution
This question has been solved!
Explore an expertly crafted, step-by-step solution for a thorough understanding of key concepts.

Step by stepSolved in 4 steps with 18 images

Knowledge Booster

Similar questions
Recommended textbooks for you
- MATLAB: An Introduction with ApplicationsStatisticsISBN:9781119256830Author:Amos GilatPublisher:John Wiley & Sons Inc
 Probability and Statistics for Engineering and th...StatisticsISBN:9781305251809Author:Jay L. DevorePublisher:Cengage Learning
 Statistics for The Behavioral Sciences (MindTap C...StatisticsISBN:9781305504912Author:Frederick J Gravetter, Larry B. WallnauPublisher:Cengage Learning
  Elementary Statistics: Picturing the World (7th E...StatisticsISBN:9780134683416Author:Ron Larson, Betsy FarberPublisher:PEARSON
 The Basic Practice of StatisticsStatisticsISBN:9781319042578Author:David S. Moore, William I. Notz, Michael A. FlignerPublisher:W. H. Freeman
 Introduction to the Practice of StatisticsStatisticsISBN:9781319013387Author:David S. Moore, George P. McCabe, Bruce A. CraigPublisher:W. H. Freeman
MATLAB: An Introduction with Applications
Statistics
ISBN:9781119256830
Author:Amos Gilat
Publisher:John Wiley & Sons Inc
Probability and Statistics for Engineering and th...
Statistics
ISBN:9781305251809
Author:Jay L. Devore
Publisher:Cengage Learning
Statistics for The Behavioral Sciences (MindTap C...
Statistics
ISBN:9781305504912
Author:Frederick J Gravetter, Larry B. Wallnau
Publisher:Cengage Learning
Elementary Statistics: Picturing the World (7th E...
Statistics
ISBN:9780134683416
Author:Ron Larson, Betsy Farber
Publisher:PEARSON
The Basic Practice of Statistics
Statistics
ISBN:9781319042578
Author:David S. Moore, William I. Notz, Michael A. Fligner
Publisher:W. H. Freeman
Introduction to the Practice of Statistics
Statistics
ISBN:9781319013387
Author:David S. Moore, George P. McCabe, Bruce A. Craig
Publisher:W. H. Freeman