MATLAB: An Introduction with Applications
6th Edition
ISBN: 9781119256830
Author: Amos Gilat
Publisher: John Wiley & Sons Inc
expand_more
expand_more
format_list_bulleted
Question

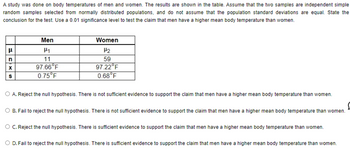
Transcribed Image Text:A study was done on body temperatures of men and women. The results are shown in the table. Assume that the two samples are independent simple
random samples selected from normally distributed populations, and do not assume that the population standard deviations are equal. State the
conclusion for the test. Use a 0.01 significance level to test the claim that men have a higher mean body temperature than women.
μ
n
X
S
Men
H₁
11
97.66°F
0.75°F
Women
H₂
59
97.22°F
0.68°F
O A. Reject the null hypothesis. There is not sufficient evidence to support the claim that men have a higher mean body temperature than women.
O B. Fail to reject the null hypothesis. There is not sufficient evidence to support the claim that men have a higher mean body temperature than women.
O C. Reject the null hypothesis. There is sufficient evidence to support the claim that men have a higher mean body temperature than women.
O D. Fail to reject the null hypothesis. There is sufficient evidence to support the claim that men have a higher mean body temperature than women.
Expert Solution
This question has been solved!
Explore an expertly crafted, step-by-step solution for a thorough understanding of key concepts.
Step by stepSolved in 4 steps with 1 images

Knowledge Booster
Similar questions
- * Question Completion Status: OC. 0.0099 d. 0.0918 QUESTION 3 EPA fuel economy estimates for automobile models tested recently predicts a mean of 24 mpg and a standard deviation of 6 mpg. Assume that a Normal model applies, N(24, 6 ). What mpg for the automobiles would be the cutoff value for the lowest 10% of the mpg's (the 10th percentile of gas mileage)? O a. 12.80 mpg O b. 10.00 mpg O c. 31.38 mpg O d. 16.32 mpg QUESTION 4arrow_forwardHi Can you please fill out the blanks?arrow_forwardIn a normally distributed data set a mean of 31 where 95% of the data fall between 27.4 and 34.6, what would be the standard deviation of that data set? Homework Help: 4VG. Empirical Rule with examples > (4:38) 4DE. Standard scores and the Empirical Rule (DOCX) 2.6 O 7.6 1.8 3.1arrow_forward
- Calculate the sample standard deviation- question at the bottom. I solved everything else on my own.arrow_forwardfind the mean and standard deviation for A B C Sample a: 12. 21.30 Sample b: 70, 79,88 Sample c:1,045, 1,054, 1063 also what does this exercise show about the standard deviation?arrow_forwardi already have answer in question A-C. please help me answer the rest. topic unknown standard variation thank youarrow_forward
arrow_back_ios
arrow_forward_ios
Recommended textbooks for you
 MATLAB: An Introduction with ApplicationsStatisticsISBN:9781119256830Author:Amos GilatPublisher:John Wiley & Sons Inc
 Probability and Statistics for Engineering and th...StatisticsISBN:9781305251809Author:Jay L. DevorePublisher:Cengage Learning
 Statistics for The Behavioral Sciences (MindTap C...StatisticsISBN:9781305504912Author:Frederick J Gravetter, Larry B. WallnauPublisher:Cengage Learning
 Elementary Statistics: Picturing the World (7th E...StatisticsISBN:9780134683416Author:Ron Larson, Betsy FarberPublisher:PEARSON
 The Basic Practice of StatisticsStatisticsISBN:9781319042578Author:David S. Moore, William I. Notz, Michael A. FlignerPublisher:W. H. Freeman
 Introduction to the Practice of StatisticsStatisticsISBN:9781319013387Author:David S. Moore, George P. McCabe, Bruce A. CraigPublisher:W. H. Freeman

MATLAB: An Introduction with Applications
Statistics
ISBN:9781119256830
Author:Amos Gilat
Publisher:John Wiley & Sons Inc

Probability and Statistics for Engineering and th...
Statistics
ISBN:9781305251809
Author:Jay L. Devore
Publisher:Cengage Learning

Statistics for The Behavioral Sciences (MindTap C...
Statistics
ISBN:9781305504912
Author:Frederick J Gravetter, Larry B. Wallnau
Publisher:Cengage Learning

Elementary Statistics: Picturing the World (7th E...
Statistics
ISBN:9780134683416
Author:Ron Larson, Betsy Farber
Publisher:PEARSON

The Basic Practice of Statistics
Statistics
ISBN:9781319042578
Author:David S. Moore, William I. Notz, Michael A. Fligner
Publisher:W. H. Freeman

Introduction to the Practice of Statistics
Statistics
ISBN:9781319013387
Author:David S. Moore, George P. McCabe, Bruce A. Craig
Publisher:W. H. Freeman