
MATLAB: An Introduction with Applications
6th Edition
ISBN: 9781119256830
Author: Amos Gilat
Publisher: John Wiley & Sons Inc
expand_more
expand_more
format_list_bulleted
Related questions
Question

Transcribed Image Text:Sample standard
Number of giraffes
Sample mean
deviation
Take Sample
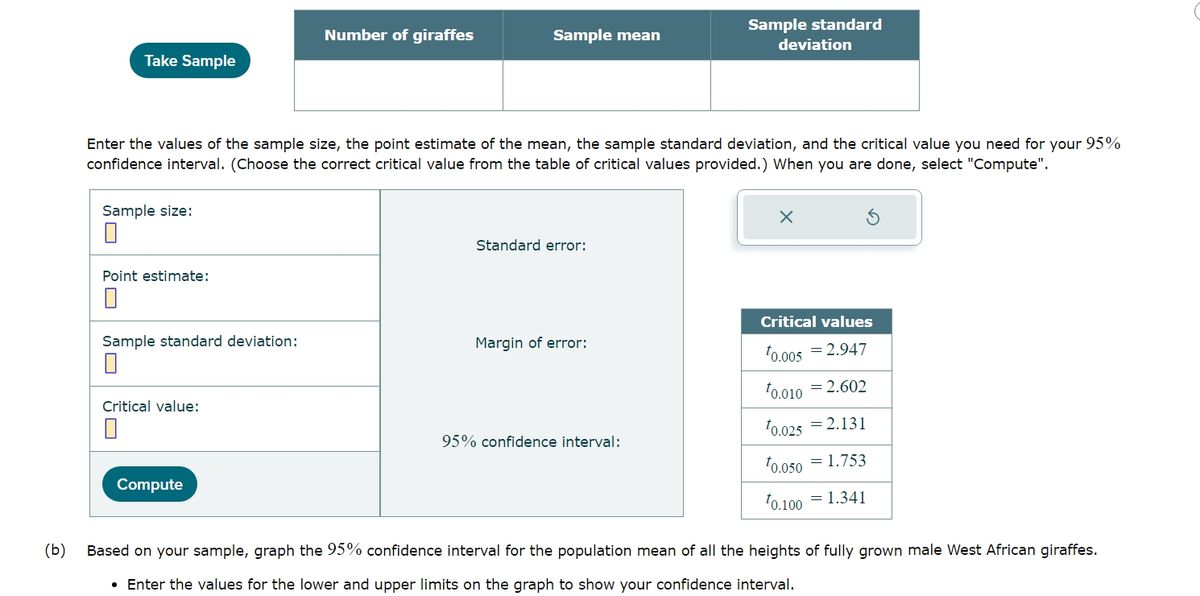
Enter the values of the sample size, the point estimate of the mean, the sample standard deviation, and the critical value you need for your 95%
confidence interval. (Choose the correct critical value from the table of critical values provided.) When you are done, select "Compute".
Sample size:
Point estimate:
Standard error:
5
Sample standard deviation:
Critical values
Margin of error:
0.005 = 2.947
Critical value:
10.010 = 2.602
95% confidence interval:
10.025 = 2.131
Compute
0.050 1.753
0.100=1.341
(b)
Based on your sample, graph the 95% confidence interval for the population mean of all the heights of fully grown male West African giraffes.
• Enter the values for the lower and upper limits on the graph to show your confidence interval.
SAVE
AI-Generated Solution
info
AI-generated content may present inaccurate or offensive content that does not represent bartleby’s views.
Unlock instant AI solutions
Tap the button
to generate a solution
to generate a solution
Click the button to generate
a solution
a solution
Knowledge Booster

Similar questions
- Keeping everything else constant, as the number of sample size decreases, which one(s) of the following would increase? Standard error. Critical Value The standard deviation of the population. Difference between Upper and Lower Prediction Intervalsarrow_forwardUse the range rule of thumb to identify the values that are significantly low, the values that are signficantly high, and the values that are neither significantly low nor significantly high. A test is used to assess readiness for college. In a recent year, the mean test score was 22.5 and the standard deviation was 5.3. Identify the test scores that are significantly low or significantly high. Question content area bottom Part 1 What test scores are significantly low? Select the correct answer below and fill in the answer box(es) to complete your choice. A. Test scores that are between enter your response here and enter your response here. (Round to one decimal place as needed. Use ascending order.) B. Test scores that are greater than enter your response here. (Round to one decimal place as needed.) C. Test scores that are less than enter your response here. (Round to one decimal place as needed.)arrow_forwardUse the accompanying Grade Point Averages data to find 80%, 85%, and 99% confidence intervals for the mean GPA Click the icon to view the Grade Point Averages data. www An 80% confidence interval for the mean GPA is (Use ascending order. Round to two decimal places as needed.) Gender Female Female Female Female Male Female Female Female Female Female Female Female Female Male Male Female Male Female Male Female Female Female Female Female Female Female Male Female Female Male Collage Nursing Nursing Arts and Sciences Arts and Sciences Engineering Nursing Nursing Education Arts and Scances Nursing Arts and Sciences Nursing Health Science Business Business Nursing Education Education Engineering Arts and Sciences Health Science Business Health Science Nursing Engineering Education Engineering Education Nursing Engineering GPA 3.20 3.26 3.13 3,61 3.00 3.67 3.36 3.45 3.50 3.20 2.68 3.40 3.76 3.74 3.75 3.48 2.92 3.80 3.51 3.72 3.28 3.26 3.70 3.40 3,17 3.44 3.87 3.29 3.25 3.72arrow_forward
- Use the confidence interval to find the estimated margin of error. Then find the sample mean. A biologist reports a confidence interval of (3.9,5.5) when estimating the mean height (in centimeters) of a sample of seedlings. Question content area bottom Part 1 The estimated margin of error is enter your response here .arrow_forwardA sample mean, sample size, population standard deviation, and confidence level are provided. Use this information to complete parts (a) through (c) below. x=35, n=27, σ=5 confidence level=90% a. Use the one-mean z-interval procedure to find a confidence interval for the mean of the population from which the sample was drawn. The confidence interval is from _______ to _________. (Type integers or decimals rounded to one decimal place as needed.) b. Obtain the margin of error by taking half the length of the confidence interval. What is the length of the confidence interval? ____________ (Type an integer or decimal rounded to one decimal place as needed.) c. Obtain the margin of error by using the formula E=zα2•σn. Identify the critical value. zα2=____________ (Type an integer or decimal rounded to two decimal places as needed.) What is the margin of error obtained using the methods of parts (b) and(c)? _________ (Type an integer or decimal…arrow_forwardhelp please answer in text form with proper workings and explanation for each and every part and steps with concept and introduction no AI no copy paste remember answer must be in proper format with all workingarrow_forward
- Constructing Confidence Intervals you are given the sample mean and the population standard deviation. Use this information to construct 90% and 95% confidence intervals for the population mean. Interpret the results and compare the widths of the confidence intervals. Q. Stock Prices From a random sample of 36 business days during the year 2020, the mean closing price of Apple stock was $97.17. Assume the population standard deviation is $21.77. (Source: Nasdaq)arrow_forwardSample size n=25, a normal distribution with a mean of u=100. Standard divination=25 find the range of sample means what defines the middle 95% of the distribution of sample means and find the range of sample means that defines the middle 99% of the distribution of sample meansarrow_forward
arrow_back_ios
arrow_forward_ios
Recommended textbooks for you
- MATLAB: An Introduction with ApplicationsStatisticsISBN:9781119256830Author:Amos GilatPublisher:John Wiley & Sons Inc
 Probability and Statistics for Engineering and th...StatisticsISBN:9781305251809Author:Jay L. DevorePublisher:Cengage Learning
 Statistics for The Behavioral Sciences (MindTap C...StatisticsISBN:9781305504912Author:Frederick J Gravetter, Larry B. WallnauPublisher:Cengage Learning
  Elementary Statistics: Picturing the World (7th E...StatisticsISBN:9780134683416Author:Ron Larson, Betsy FarberPublisher:PEARSON
 The Basic Practice of StatisticsStatisticsISBN:9781319042578Author:David S. Moore, William I. Notz, Michael A. FlignerPublisher:W. H. Freeman
 Introduction to the Practice of StatisticsStatisticsISBN:9781319013387Author:David S. Moore, George P. McCabe, Bruce A. CraigPublisher:W. H. Freeman
MATLAB: An Introduction with Applications
Statistics
ISBN:9781119256830
Author:Amos Gilat
Publisher:John Wiley & Sons Inc
Probability and Statistics for Engineering and th...
Statistics
ISBN:9781305251809
Author:Jay L. Devore
Publisher:Cengage Learning
Statistics for The Behavioral Sciences (MindTap C...
Statistics
ISBN:9781305504912
Author:Frederick J Gravetter, Larry B. Wallnau
Publisher:Cengage Learning
Elementary Statistics: Picturing the World (7th E...
Statistics
ISBN:9780134683416
Author:Ron Larson, Betsy Farber
Publisher:PEARSON
The Basic Practice of Statistics
Statistics
ISBN:9781319042578
Author:David S. Moore, William I. Notz, Michael A. Fligner
Publisher:W. H. Freeman
Introduction to the Practice of Statistics
Statistics
ISBN:9781319013387
Author:David S. Moore, George P. McCabe, Bruce A. Craig
Publisher:W. H. Freeman