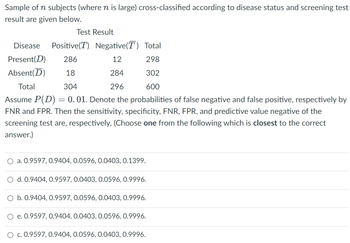

Contingency Table (2x2 Table): You should be familiar with the structure of a contingency table, which is used to organize data for binary classification problems, such as medical screening tests. It typically includes four values: true positives (TP), true negatives (TN), false positives (FP), and false negatives (FN).
True Positives (TP): These are cases where the screening test correctly identifies individuals who have the condition or disease.
True Negatives (TN): These are cases where the screening test correctly identifies individuals who do not have the condition or disease.
False Positives (FP): These are cases where the screening test incorrectly identifies individuals as having the condition or disease when they do not.
False Negatives (FN): These are cases where the screening test incorrectly identifies individuals as not having the condition or disease when they actually do.
Sensitivity: Sensitivity is a measure of how well a screening test correctly identifies individuals with the condition. It is calculated as TP / (TP + FN) and represents the true positive rate.
Specificity: Specificity is a measure of how well a screening test correctly identifies individuals without the condition. It is calculated as TN / (TN + FP) and represents the true negative rate.
False Negative Rate (FNR): FNR is the proportion of individuals with the condition who are incorrectly classified as not having it. It is calculated as FN / (TP + FN).
Trending nowThis is a popular solution!
Step by stepSolved in 3 steps

- 4arrow_forwardFind the variance of x or the number of cups of coffee. (Do not round intermediate steps but round your final answer to 4 decimal places)arrow_forwardSuppose 2 dice are rolled, and suppose the discrete variable x counts the number of 3’s that show up. Plot the probability distribution for x using a bar graph. What is the expected value for the random variable x? What is the variance for the random variable x?arrow_forward
- Is the expected value (mean) of the probability distribution of a random variable always one of the possible values of x from the distribution? ExplainWhy notarrow_forwardThe probability distribution itself is assumed to be a beta distribution. True or false?arrow_forwardIs the expected value (mean) of the probability distribution of a random variable always one of the possible values of x from the distribution ? Explainarrow_forward
 MATLAB: An Introduction with ApplicationsStatisticsISBN:9781119256830Author:Amos GilatPublisher:John Wiley & Sons Inc
 Probability and Statistics for Engineering and th...StatisticsISBN:9781305251809Author:Jay L. DevorePublisher:Cengage Learning
 Statistics for The Behavioral Sciences (MindTap C...StatisticsISBN:9781305504912Author:Frederick J Gravetter, Larry B. WallnauPublisher:Cengage Learning
 Elementary Statistics: Picturing the World (7th E...StatisticsISBN:9780134683416Author:Ron Larson, Betsy FarberPublisher:PEARSON
 The Basic Practice of StatisticsStatisticsISBN:9781319042578Author:David S. Moore, William I. Notz, Michael A. FlignerPublisher:W. H. Freeman
 Introduction to the Practice of StatisticsStatisticsISBN:9781319013387Author:David S. Moore, George P. McCabe, Bruce A. CraigPublisher:W. H. Freeman


