MATLAB: An Introduction with Applications
6th Edition
ISBN: 9781119256830
Author: Amos Gilat
Publisher: John Wiley & Sons Inc
expand_more
expand_more
format_list_bulleted
Question

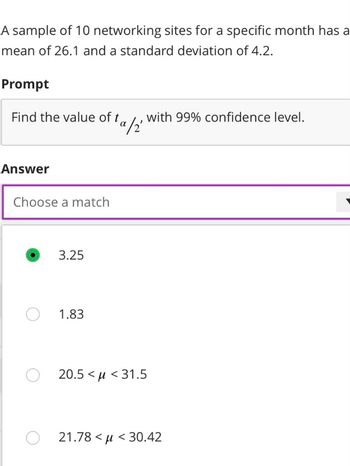
Transcribed Image Text:A sample of 10 networking sites for a specific month has a
mean of 26.1 and a standard deviation of 4.2.
Prompt
Find the value of ta
Answer
Choose a match
O
3.25
1.83
ta/2
with 99% confidence level.
O 20.5 μ<31.5
O21.78 <μ< 30.42

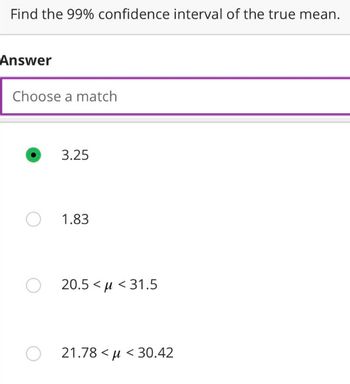
Transcribed Image Text:Find the 99% confidence interval of the true mean.
Answer
Choose a match
3.25
O 1.83
O 20.5<<31.5
O21.78<μ< 30.42
Expert Solution
This question has been solved!
Explore an expertly crafted, step-by-step solution for a thorough understanding of key concepts.
This is a popular solution
Trending nowThis is a popular solution!
Step by stepSolved in 3 steps with 1 images

Knowledge Booster
Similar questions
- The additional growth of plants in one week are recorded for 6 plants with a sample standard deviation of 2 inches and sample mean of 9 inches. t∗ at the 0.05 significance level = Margin of error = Confidence interval = [ , ]arrow_forwardThe average number of prescriptions filled at a pharmacy per person in theUnited States in 2019 was 11.6. An Illinois health official wants to testwhether or not the mean number of prescriptions per capita in Illinois isdifferent than 11.6. They randomly sample 104 Illinois residents andcompute a sample mean of 10.9 prescriptions per person. Assume that thepopulation standard deviation is known to be σ = 3.2 prescriptions perperson. The official will conduct the test at a 5% significance level. g. Does the decision change at a 1% significance level? Explainarrow_forwardStudies on a machine that molds plastic water pipe indicate that when it is injecting 1-inch-diameter pipe, the process standard deviation is 0.05 inches. The 1-inch pipe has a specification of 1 inch plus or minus 0.10 inch. The long-run process mean is 1 inch. Process capability index (Cp) = 0.67 Is this process capable? Multiple Choice Yes, because the process capability is below 100. No, because the process capability is below 1.33 No, because the process capability is above 0.50. Yes, because the process capability is above 0.50.arrow_forward
- The average size of a farm in one county is 162 acres with a standard deviation of 38 acres. The average size of a farm in a second county is 182 acres with a standard deviation of 16 acres. Assume the data were obtained from two samples that had 30 farms each. Can it be concluded that the average size of the farms in the two counties is different? (Let α = 0.05) First , choose which hypothesis statements is correct. T-stat = Round to 2 decimal places. P-value = Decision: Type Retain Ho or Reject Hoarrow_forwardThe additional growth of plants in one week are recorded for 6 plants with a sample standard deviation of 1 inches and sample mean of 12 inches. t∗ at the 0.10 significance level = Margin of error = Confidence interval = [ , ] [smaller value, larger value]arrow_forwardA particular brand of cereal advertises it packages weigh 510 g.You wish to determine if on the average the weight is less than 510g. A simple randomsample of 81 packages from a large lot are weighed. The average weight is found to be509.5 g with a standard deviation of 0.4 g. 1. Perform a test at a level of significance 0.05. 2. What is the power of the test if you wish to detect an average departure of 0.2 gunderweight (can be stated as weighing 509.8g). 3. What sample size is needed to have a power of 90%? Please show all steps. Thank you!arrow_forward
- A random sample of 100 lightning flashes in a certain region resulted in a sample average radar echo duration of .81 sec and a sample standard deviation of .34 sec. Calculate a 98% (two-sided) confidence interval for the true average echo duration p. Round final answer to 3 decimal places (i.e., x.xxx). CI =( ? , ? )arrow_forwardA company produces laundry deyergents wants to estimate the mean amount of detergent in their 64 ounce jugs qt a 99% confidence level. The cimpany knows that tge standard deviation of amounys of detergent in such jugs is 0.20 ounce. How large a sample should the company take so that the estimate is within 0.04 ounce of the population mean?arrow_forwardIn a random sample of twelvetwelve cell phones, the mean full retail price was $591.50591.50 and the standard deviation was $179.00179.00. Assume the population is normally distributed and use the t-distribution to find the margin of error and construct a 9090% confidence interval for the population mean muμ. Interpret the results.arrow_forward
- A local hardware store claims that the mean waiting time in line is less than 3.5 minutes. A random sample of 20 customers has a mean of 3.2 minutes with a standard deviation 0.8 minute. If a = 0.10, test the store's claim. Ho: u = 3.5 Hạ: H [ Select ] Test statistic: [ Select ] p-Value = [ Select ] Decision: [ Select ] > > >arrow_forwardHelp plsarrow_forward
arrow_back_ios
arrow_forward_ios
Recommended textbooks for you
 MATLAB: An Introduction with ApplicationsStatisticsISBN:9781119256830Author:Amos GilatPublisher:John Wiley & Sons Inc
 Probability and Statistics for Engineering and th...StatisticsISBN:9781305251809Author:Jay L. DevorePublisher:Cengage Learning
 Statistics for The Behavioral Sciences (MindTap C...StatisticsISBN:9781305504912Author:Frederick J Gravetter, Larry B. WallnauPublisher:Cengage Learning
 Elementary Statistics: Picturing the World (7th E...StatisticsISBN:9780134683416Author:Ron Larson, Betsy FarberPublisher:PEARSON
 The Basic Practice of StatisticsStatisticsISBN:9781319042578Author:David S. Moore, William I. Notz, Michael A. FlignerPublisher:W. H. Freeman
 Introduction to the Practice of StatisticsStatisticsISBN:9781319013387Author:David S. Moore, George P. McCabe, Bruce A. CraigPublisher:W. H. Freeman

MATLAB: An Introduction with Applications
Statistics
ISBN:9781119256830
Author:Amos Gilat
Publisher:John Wiley & Sons Inc

Probability and Statistics for Engineering and th...
Statistics
ISBN:9781305251809
Author:Jay L. Devore
Publisher:Cengage Learning

Statistics for The Behavioral Sciences (MindTap C...
Statistics
ISBN:9781305504912
Author:Frederick J Gravetter, Larry B. Wallnau
Publisher:Cengage Learning

Elementary Statistics: Picturing the World (7th E...
Statistics
ISBN:9780134683416
Author:Ron Larson, Betsy Farber
Publisher:PEARSON

The Basic Practice of Statistics
Statistics
ISBN:9781319042578
Author:David S. Moore, William I. Notz, Michael A. Fligner
Publisher:W. H. Freeman

Introduction to the Practice of Statistics
Statistics
ISBN:9781319013387
Author:David S. Moore, George P. McCabe, Bruce A. Craig
Publisher:W. H. Freeman