MATLAB: An Introduction with Applications
6th Edition
ISBN: 9781119256830
Author: Amos Gilat
Publisher: John Wiley & Sons Inc
expand_more
expand_more
format_list_bulleted
Question

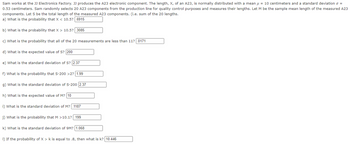
Transcribed Image Text:Sam works at the JJ Electronics Factory. JJ produces the A23 electronic component. The length, X, of an A23, is normally distributed with a meanu = 10 centimeters and a standard deviation o =
0.53 centimeters. Sam randomly selects 20 A23 components from the production line for quality control purposes and measures their lengths. Let M be the sample mean length of the measured A23
components. Let S be the total length of the measured A23 components. (i.e. sum of the 20 lengths.
a) What is the probability that X < 10.5? .6915
b) What is the probability that X > 10.5? .3085
c) What is the probability that all of the 20 measurements are less than 11? .0171
d) What is the expected value of S? 200
e) What is the standard deviation of S? 2.37
f) What is the probability that S-200 >2? 1.99
g) What is the standard deviation of S-200 2.37
h) What is the expected value of M? 10
i) What is the standard deviation of M? .1187
j) What is the probability that M >10.1? .199
k) What is the standard deviation of 9M? 1.068
1) If the probability of X >k is equal to .8, then what is k? 10.446
Expert Solution
This question has been solved!
Explore an expertly crafted, step-by-step solution for a thorough understanding of key concepts.
This is a popular solution
Trending nowThis is a popular solution!
Step by stepSolved in 4 steps with 3 images

Knowledge Booster
Similar questions
- Suppose that the daily intake of an adult follows a uniform distribution from 40 to 65 micrograms. Suppose that 36 adults are randomly selected. What is the mean and standard deviation of the average intake for 36 adults. a. Mean= 52.5 stvdev = 1.2 b. Mean = 55 stvdev= 7.22c. Mean = 52.5 stvdev = 2.08 d. Mean= 52.5 stvdev = 7.22arrow_forwardUse Chebyshevs rule and the empirical rule to describe the distribution of this data set. Count the actual number of observations that fall within one, two, and three standard deviations of the mean if the data set and compare these counts with the description of the the data set I developed.arrow_forwardRachael got a 660 on the analytical portion of the Graduate Record Exam (GRE). If GRE scores are normally distributed and have mean μ = 600 and standard deviation σ = 30, what is her standardized score?arrow_forward
- let x be a ramdom variable with mean= 150 and standard deviation =4.2. Ramdom samples of fixed size n=30 are drawn from the distribution of x. determine the distribution, mean, and standard deviation of sample meanarrow_forwardAssume that you have been provided the following information for a sample of cars The covariance between weight and miles per gallon is equal to -4.9 pound-miles. The standard deviation of the cars' mileages is 7.75. The standard deviation of the cars' weights is 0.94. Estimate the correlation coefficient to the first decimal place.arrow_forwardA population has a mean μ=139 and a standard deviation σ=24. Find the mean and standard deviation of the sampling distribution of sample means with sample size n=48.arrow_forward
- Calculate the test statistic (t) and p-value.arrow_forwardA researcher collects data that represents the average number of hours of sleep in the last two nights by 8 depressed patients and 9 non-depressed patients. The researcher is interested in whether the two groups reliably differ in the amount of sleep they get. Use Jamovi to calculate t-obt and the p value.arrow_forwardA manufacturing company produces bearings. One line of bearings is specified to be 1.64 centimeters (cm) in diameter. A major customer requires that the variance of the bearings be no more than .001 cm². The producer is required to test the bearings before they are shipped, and so the diameters of 16 bearings are measured with a precise instrument, resulting in the following values. Assume bearing diameters are normally distributed. Use the data and a = 0.01 to test to determine whether the population of these bearings is to be rejected because of too high a variance. 1.68 1.62 1.63 1.70 1.66 1.63 1.65 1.71 1.64 1.69 1.57 1.64 1.59 1.66 1.63 1.65 Appendix A Statistical Tables (Round your answer to 2 decimal places, e.g. 15.25.) The value of the test statistic is and we reject the null hypothesis ⇒arrow_forward
arrow_back_ios
arrow_forward_ios
Recommended textbooks for you
 MATLAB: An Introduction with ApplicationsStatisticsISBN:9781119256830Author:Amos GilatPublisher:John Wiley & Sons Inc
 Probability and Statistics for Engineering and th...StatisticsISBN:9781305251809Author:Jay L. DevorePublisher:Cengage Learning
 Statistics for The Behavioral Sciences (MindTap C...StatisticsISBN:9781305504912Author:Frederick J Gravetter, Larry B. WallnauPublisher:Cengage Learning
 Elementary Statistics: Picturing the World (7th E...StatisticsISBN:9780134683416Author:Ron Larson, Betsy FarberPublisher:PEARSON
 The Basic Practice of StatisticsStatisticsISBN:9781319042578Author:David S. Moore, William I. Notz, Michael A. FlignerPublisher:W. H. Freeman
 Introduction to the Practice of StatisticsStatisticsISBN:9781319013387Author:David S. Moore, George P. McCabe, Bruce A. CraigPublisher:W. H. Freeman

MATLAB: An Introduction with Applications
Statistics
ISBN:9781119256830
Author:Amos Gilat
Publisher:John Wiley & Sons Inc

Probability and Statistics for Engineering and th...
Statistics
ISBN:9781305251809
Author:Jay L. Devore
Publisher:Cengage Learning

Statistics for The Behavioral Sciences (MindTap C...
Statistics
ISBN:9781305504912
Author:Frederick J Gravetter, Larry B. Wallnau
Publisher:Cengage Learning

Elementary Statistics: Picturing the World (7th E...
Statistics
ISBN:9780134683416
Author:Ron Larson, Betsy Farber
Publisher:PEARSON

The Basic Practice of Statistics
Statistics
ISBN:9781319042578
Author:David S. Moore, William I. Notz, Michael A. Fligner
Publisher:W. H. Freeman

Introduction to the Practice of Statistics
Statistics
ISBN:9781319013387
Author:David S. Moore, George P. McCabe, Bruce A. Craig
Publisher:W. H. Freeman