MATLAB: An Introduction with Applications
6th Edition
ISBN: 9781119256830
Author: Amos Gilat
Publisher: John Wiley & Sons Inc
expand_more
expand_more
format_list_bulleted
Question
14

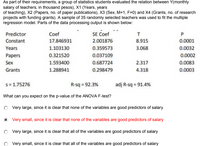
Transcribed Image Text:As part of their requirements, a group of statistics students evaluated the relation between Y(monthly
salary of teachers, in thousand pesos), X1 (Years, years
of teaching), X2 (Papers, no. of paper publications), X3 (Sex, M=1, F=0) and X4 (Grants, no. of research
projects with funding grants). A sample of 35 randomly selected teachers was used to fit the multiple
regression model. Parts of the data processing output is shown below:
Coef
SE Coef
Predictor
T
Constant
17.846931
2.001876
8.915
0.0001
Years
1.103130
0.359573
3.068
0.0032
Papers
0.321520
0.037109
0.0002
Sex
1.593400
0.687724
2.317
0.0083
Grants
1.288941
0.298479
4.318
0.0003
s= 1.75276
R-sq = 92.3%
adj R-sq = 91.4%
What can you expect on the p-value of the ANOVA F-test?
O Very large, since it is clear that none of the variables are good predictors of salary
Very small, since it is clear that none of the variables are good predictors of salary
O Very large, since it is clear that all of the variables are good predictors of salary
O Very small, since it is clear that all of the variables are good predictors of salary
Expert Solution
This question has been solved!
Explore an expertly crafted, step-by-step solution for a thorough understanding of key concepts.
Step by stepSolved in 2 steps

Knowledge Booster
Similar questions
Recommended textbooks for you
 MATLAB: An Introduction with ApplicationsStatisticsISBN:9781119256830Author:Amos GilatPublisher:John Wiley & Sons Inc
 Probability and Statistics for Engineering and th...StatisticsISBN:9781305251809Author:Jay L. DevorePublisher:Cengage Learning
 Statistics for The Behavioral Sciences (MindTap C...StatisticsISBN:9781305504912Author:Frederick J Gravetter, Larry B. WallnauPublisher:Cengage Learning
 Elementary Statistics: Picturing the World (7th E...StatisticsISBN:9780134683416Author:Ron Larson, Betsy FarberPublisher:PEARSON
 The Basic Practice of StatisticsStatisticsISBN:9781319042578Author:David S. Moore, William I. Notz, Michael A. FlignerPublisher:W. H. Freeman
 Introduction to the Practice of StatisticsStatisticsISBN:9781319013387Author:David S. Moore, George P. McCabe, Bruce A. CraigPublisher:W. H. Freeman

MATLAB: An Introduction with Applications
Statistics
ISBN:9781119256830
Author:Amos Gilat
Publisher:John Wiley & Sons Inc

Probability and Statistics for Engineering and th...
Statistics
ISBN:9781305251809
Author:Jay L. Devore
Publisher:Cengage Learning

Statistics for The Behavioral Sciences (MindTap C...
Statistics
ISBN:9781305504912
Author:Frederick J Gravetter, Larry B. Wallnau
Publisher:Cengage Learning

Elementary Statistics: Picturing the World (7th E...
Statistics
ISBN:9780134683416
Author:Ron Larson, Betsy Farber
Publisher:PEARSON

The Basic Practice of Statistics
Statistics
ISBN:9781319042578
Author:David S. Moore, William I. Notz, Michael A. Fligner
Publisher:W. H. Freeman

Introduction to the Practice of Statistics
Statistics
ISBN:9781319013387
Author:David S. Moore, George P. McCabe, Bruce A. Craig
Publisher:W. H. Freeman