MATLAB: An Introduction with Applications
6th Edition
ISBN: 9781119256830
Author: Amos Gilat
Publisher: John Wiley & Sons Inc
expand_more
expand_more
format_list_bulleted
Question
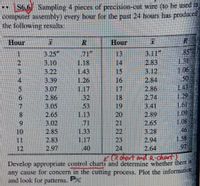
Develop the appropriate control charts (X-chart and R-chart) and determine whether there is any cause for concern in the cutting process. Plot the information and look for patterns.

Transcribed Image Text:[S6.6
S6.6 Sampling 4 pieces of precision-cut wire (to be used in
computer assembly) every hour for the past 24 hours has produccd
the following results:
Hour
Hour
R.
85
1.310
1.06
50
L43
1.29
1.61
3.25"
3.10
1.
71"
13
3.11"
2.83
3.12
2.84
14,
15
16
17
18
19
20
21
22
23
24
70xohort adR-chart)
1.18
1.43
1.26
1.17
.32
53
3.22
3.39
5.
3.07
2.86
2.86
3.05
2.65
2.74
3.41
7.
8.
1.09
1.08
46
1.58
97
1.13
2.89
2.65
3.28
2.94
2.64
.71
3.02
2.85
2.83
2.97
1.33
10
11
12
1.17
40
Develop appropriate control charts and determine whether there 15
any cause for concern in the cutting process. Plot the information
and look for patterns.
Expert Solution
This question has been solved!
Explore an expertly crafted, step-by-step solution for a thorough understanding of key concepts.
This is a popular solution
Trending nowThis is a popular solution!
Step by stepSolved in 5 steps with 3 images

Knowledge Booster
Similar questions
- Use the same scales to construct modified boxplots for the pulse rates of males and females from the accompanying data sets. Identify any outliers. Use the boxplots to compare the two data sets. Click the icon to view the data sets. Determine the boxplot for the men's pulse rate data. Choose the correct graph below. O A. O C. xx HE 40 50 60 70 80 90 100110 O C. What points are outliers? OA. 46 O B. 46, 89, 105 OC. 46, 48, 105 O D. 105 40 50 60 70 80 90 100110 -ידי xH Determine the boxplot for the women's boxplot data. Choose the correct graph below. O A. Q 40 50 60 70 80 90 100110 xH Q 40 50 60 70 80 90 100110 Q ✔ Q ✔ C O B. O D. O B. O D. 841x 40 50 60 70 80 90 100110 X 40 50 60 70 80 90 100110 40 50 60 70 80 90 100110 XX 40 50 60 70 80 90 100110 Q Q M Q Q ✔ Pulse rates for men and women Men's Pulse Rates 59 72 72 58 84 50 58 65 66 55 105 64 65 77 70 62 Women's Pulse Rates 76 70 74 83 59 67 65 72 74 89 85 78 56 80 60 46 70 59 70 75 66 68 66 72 77 78 97 74 62 81 54 74 77 79 89 95 59 98…arrow_forwardTwenty salesmen were asked how many phone calls they made on a givan day. The data was ecorded in the table balow. Construct a dot plot for the sat. 15 12 0 1 2 3 4 5 0 1 2 3 4 5 0 1 2 3 4 5 0 1 2 34 5arrow_forwardfind the point estimate for observation.arrow_forward
- Interpret the side-by-side (comparative) box-and-whisker plot using the five-number summary. Compare and discuss the typical annual starting salaries for each major. What conclusions can be drawn? Describe each distribution for accounting and marketing majors' annual starting salary.arrow_forwardDefine effect size in your own words pleasearrow_forward3. Which box plot has the largest interquartile range?arrow_forward
arrow_back_ios
arrow_forward_ios
Recommended textbooks for you
 MATLAB: An Introduction with ApplicationsStatisticsISBN:9781119256830Author:Amos GilatPublisher:John Wiley & Sons Inc
 Probability and Statistics for Engineering and th...StatisticsISBN:9781305251809Author:Jay L. DevorePublisher:Cengage Learning
 Statistics for The Behavioral Sciences (MindTap C...StatisticsISBN:9781305504912Author:Frederick J Gravetter, Larry B. WallnauPublisher:Cengage Learning
 Elementary Statistics: Picturing the World (7th E...StatisticsISBN:9780134683416Author:Ron Larson, Betsy FarberPublisher:PEARSON
 The Basic Practice of StatisticsStatisticsISBN:9781319042578Author:David S. Moore, William I. Notz, Michael A. FlignerPublisher:W. H. Freeman
 Introduction to the Practice of StatisticsStatisticsISBN:9781319013387Author:David S. Moore, George P. McCabe, Bruce A. CraigPublisher:W. H. Freeman

MATLAB: An Introduction with Applications
Statistics
ISBN:9781119256830
Author:Amos Gilat
Publisher:John Wiley & Sons Inc

Probability and Statistics for Engineering and th...
Statistics
ISBN:9781305251809
Author:Jay L. Devore
Publisher:Cengage Learning

Statistics for The Behavioral Sciences (MindTap C...
Statistics
ISBN:9781305504912
Author:Frederick J Gravetter, Larry B. Wallnau
Publisher:Cengage Learning

Elementary Statistics: Picturing the World (7th E...
Statistics
ISBN:9780134683416
Author:Ron Larson, Betsy Farber
Publisher:PEARSON

The Basic Practice of Statistics
Statistics
ISBN:9781319042578
Author:David S. Moore, William I. Notz, Michael A. Fligner
Publisher:W. H. Freeman

Introduction to the Practice of Statistics
Statistics
ISBN:9781319013387
Author:David S. Moore, George P. McCabe, Bruce A. Craig
Publisher:W. H. Freeman