
MATLAB: An Introduction with Applications
6th Edition
ISBN: 9781119256830
Author: Amos Gilat
Publisher: John Wiley & Sons Inc
expand_more
expand_more
format_list_bulleted
Related questions
Question
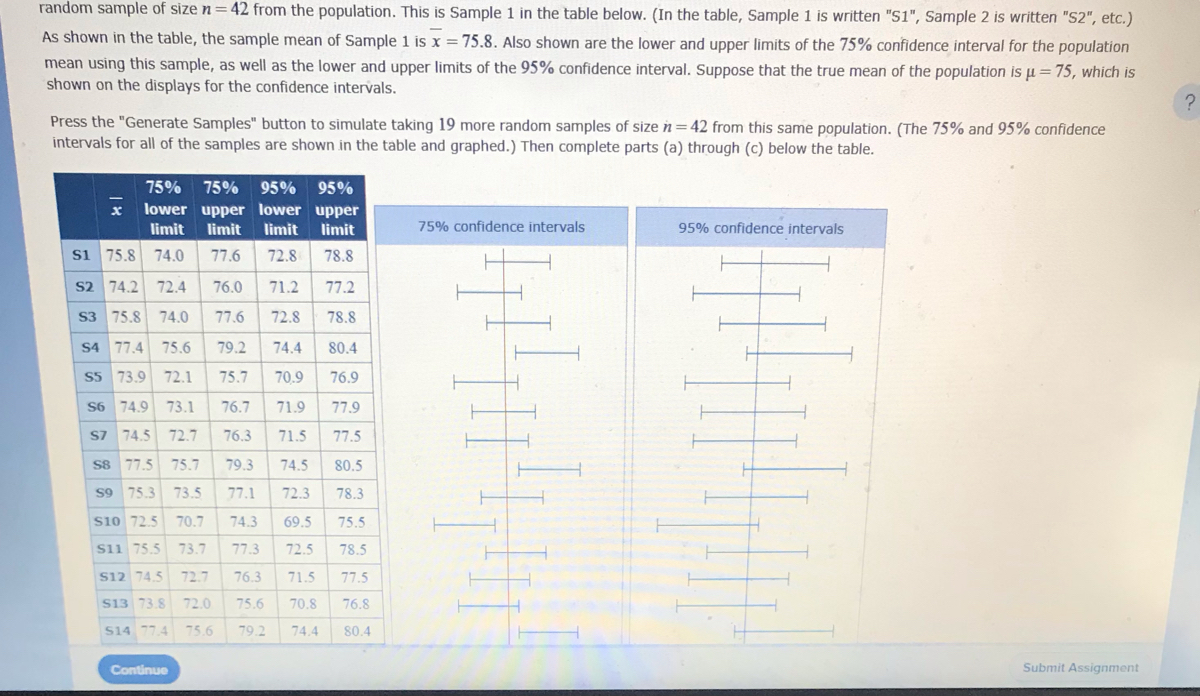

Transcribed Image Text:random sample of size n=42 from the population. This is Sample 1 in the table below. (In the table, Sample 1 is written "S1", Sample 2 is written "S2", etc.)
As shown in the table, the sample mean of Sample 1 is x = 75.8. Also shown are the lower and upper limits of the 75% confidence interval for the population
mean using this sample, as well as the lower and upper limits of the 95% confidence interval. Suppose that the true mean of the population is u=75, which is
shown on the displays for the confidence intervals.
Press the "Generate Samples" button to simulate taking 19 more random samples of size n = 42 from this same population. (The 75% and 95% confidence
intervals for all of the samples are shown in the table and graphed.) Then complete parts (a) through (c) below the table.
75% 75% 95% 95%
lower upper lower upper
limit limit limit limit
S1 75.8 74.0 77.6 72.8 78.8
S2 74.2 72.4 76.0 71.2 77.2
S3 75.8 74.0 77.6 72.8 78.8
S4 77.4 75.6 79.2 74.4 80.4
S5 73.9 72.1 75.7 70.9 76.9
S6 74.9 73.1 76.7 71.9 77.9
S7 74.5 72.7 76.3 71.5 77.5
S8 77.5 75.7 79.3 74.5 80.5
S9 75.3 73.5
77.1 72.3 78.3
74.3 69.5 75.5
77.3 72.5 78.5
76.3 71.5 77.5
75.6
79.2
70.8 76.8
80.4
x
510 725 70.7
S11 755 73.7
S12 74.5 72.7
S13 73.8 72.0
S14 77.4 75.6
Continue
74.4
75% confidence intervals
95% confidence intervals
Submit Assignment
?

Transcribed Image Text:S15 76.1 74.3 77.9 73.1 79.1
$16 75.4 73.6 77.2 72.4 78.4
S17 77.4 75.6 79.2 74.4 80.4
S18 76.3 74.5 78.1 73.3
79.3
S19 76.1 74.3
77.9
73.1 79.1
S20 76.2 74.4
78.0 73.2 79.2
1
H
69.0
81.0 69.0
(a) How many of the 75% confidence intervals constructed from the 20 samples contain the population mean, μ = 75?
81.0
(b) How many of the 95% confidence intervals constructed from the 20 samples contain the population mean, μ = 75?
Continue
(c) Choose ALL that are true.
There is nothing wrong with the fact that the 95% confidence intervals are different from each other. Each confidence
interval depends on its sample, and different samples may give different confidence intervals.
It is surprising that some 75% confidence intervals are different from other 75% confidence intervals. They should
all be the same, as long as the samples are random samples from the same population.
The center of the 75% confidence interval for Sample 1 is 75.8, because the center of a confidence interval for the
population mean must be the sample mean.
We would expect to find more 95% confidence intervals that contain the population mean than 75% confidence
intervals that contain the population mean. Given a sample, a higher confidence level results in a wider interval.
None of the choices above are true.
Expert Solution
This question has been solved!
Explore an expertly crafted, step-by-step solution for a thorough understanding of key concepts.

This is a popular solution

Trending nowThis is a popular solution!

Step by stepSolved in 4 steps

Knowledge Booster

Similar questions
- Identify the following values. Consider the function shown with a graphical depiction of limƒ ( x = L , including the roles XC of & and d. 201 1.8- 1.6 1.4- 1.2- Y 1.0- 0.8- 0.6- 0.4 0.2- 0.0+T 0.0 0.2 0.4 0.6 0.8 1.0 1.2 1.4 1.6 1.8 2.0 2.2 1. 1.6 2. 1.0 E = 3. 0.4 = %3D 4. 0.6 >arrow_forwardIn a test of the effectiveness of garlic for lowering cholesterol, 50 subjects were treated with garlic in a processed tablet form. Cholesterol levels were measured before and after the treatment. The changes (before - after) in their levels of LDL cholesterol (in mg/dL) have a mean of 3.2 and a standard deviation of 17.5. Construct a 95% confidence interval estimate of the mean net change in LDL cholesterol after the garlic treatment. What does the confidence interval suggest about the effectiveness of garlic in reducing LDL cholesterol? Click here to view at distribution table. Click here to view page 1 of the standard normal distribution table. Click here to view page 2 of the standard normal distribution table. C What is the confidence interval estimate of the population mean µ? mg/dL <μ< mg/dL (Round to two decimal places as needed.) What does the confidence interval suggest about the effectiveness of the treatment? O A. The confidence interval limits do not contain 0, suggesting…arrow_forwardurgent pleqasearrow_forward
- Mag Depth 2.96 19.9 2.73 6.5 1.46 3.5 0.85 13.3 2.95 19.9 1.63 8.7 1.92 18.4 1.12 7.9 2.59 3.1 1.68 9.4 0.14 6.2 2.43 17.7 0.04 18.4 1.03 9.8 2.89 12.4 0.54 9.5 0.77 2.1 1.87 8.1 2.72 17.3 0.84 9.9 1.48 12.7 0.68 7.1 1.83 17.1 1.89 3.4 0.94 13.8 2.24 5.7 0.94 16.7 1.36 5.2 0.98 6.6 0.51 12.5 2.69 14.1 1.73 12.5 2.29 12.7 1.63 14.7 0.52 18.6 2.75 4.5 2.31 10.5 1.39 13.3 2.05 10.5 0.63 5.7 1.15 3.6 1.59 2.9 2.92 11.3 0.33 6.4 2.78 9.2 1.43 4.8 0.82 4.8 0.21 13.6 1.77 12.3 0.68 4.9 1) Check Image 2) Given that the earthquake has a magnitude of 1.1, the best predicted depth is km. (Round to one decimal place as needed.)arrow_forwardFrequency 344.7 389.1 394.3 411.8 412.1 431.9 433.5 445 447.4 452.3 465.4 466 469.2 469.2 469.2 469.8 470.6 471.7 471.8 474.9 483 483.1 485 490.4 494.8 495.8 496.8 496.8 500 506.8 512.5 516.6 520.1 520.4 524.8 534.8 545.3 547.4 558.1 556.4 558.1 558.1 580.6 564.4 572.4 577.4 585 586.2 587.8 588.2 593.8 606.1 607.8 611.4 = 18 16 14 12 10 8 6 4 2 300 350 400 450 500 Find the first quartile for this data set. Q₁ length (cm) = 550 600 650 Find the third quartile for this data set. Q3² = Find the interquartile range for this data set. IQR = = Find the lower fence separating outliers from usual values. Fence Low Find the upper fence separating outliers from usual values. Fence higharrow_forward214.26 356.79 424.96 231.51 353.89 552.75 281.93 303.66 518.15 234.62 336.36 514.07 246.55 341.26 575.65 277.97 452.59 652.23 267.33 482.71 775.82 209.67 445.44 769.54 372.05 428.84 765.86 320.02 485.78 819.89. The table below contains the total cost ($) for four tickets to a basketball game purchased on the secondary market, two beers, two soft drinks, two hot dogs, and one parking space at each arena during a recent season. a. Organize these costs as an ordered array. b. Construct a frequency distribution and a percentage distribution for these costs. c. Around what values, if any, are at least 75% of the costs of attending the game concentrated? Explain. Question content area bottom Part 1 a. Organize these costs as an ordered array. enter your response here enter your response here enter your response here enter your response here enter your response here enter your response here enter your response here enter your response here enter your…arrow_forward
- 20171.18 46831.5 21789.85 4828.121 14684.72 -12813.6 24519.65 73135.66 29135.23 42180.99 2261.035 52749.12 41403.37 26760.47 32546.79 17728.36 -2407.25 39998.17 9780.605 45741.21 37178.78 33696.61 43259.29 26814.31 31291.52 37175.38 50136.51 55886.29 8696.373 30507.27 69778.96 52346.39 -13641.8 24661.96 9746.476 50024.07 78575.84 26692.57 38463.91 30145.11 40459.87 10816.03 14662.31 44380.93 34686.81 30315.94 18222.65 39422.52 43345.67 -2355.16 49109.01 21361.93 32708.77 50170.42 11337.63 36858.01 19704.15 34739.6 10822.38 -1332.56 70582.65 45813.68 27238.56 36232.78 29583.19 51432.22 70353.96 49991.42 37953.37 24107.22 19944.66 22744.9 31955.78 53442.8 36301.04 Spreadsheet 2arrow_forwardWins Attendance (In Millions) 65 2.06 91 2.51 66 1.73 89 3.05 75 3.06 88 2.19 91 2.06 69 1.39 83 2.88 81 2.46 80 1.54 76 2.33 67 1.62 80 3.25 80 3.56 77 2.78 94 3.22 79 2.56 95 3.77 81 1.42 97 3.65 57 1.61 90 2.13 92 3.04 61 2.09 86 3.3 96 1.84 90 2.51 85 1.63 69 1.83 Draw a scatter diagram depicting the correlation between the two variables. Determine the correlation coefficient between the two variables using Excel. Present a regression output between a dependent and one independent variable. Obtain estimated coefficients and R-squared and interpret them. Write a short report on the findings.arrow_forward5.54 1.88 25.31 7.31 13.90 5.82 2.61 3.95 192.84 17. 40 25.19 7.45 10.15 15.58 2.66 4.33 84.66 15.42 25.79 6.23 25.86 12.03 20.28 4.61 33.46 13.03 20.74 6.44 Skipped 9.10 8.15 8.94 4.79 1.22 4.33 3.71 0.93 4.79 4.56 1.29 2.06 picture Click here for the Excel Data File (a) Select the correct histogram for the above data. Histogram A Histogram B Histogram C Histogram 40 Histogram 35 40 Histogram 30 35 40 25 30 35 20 25 30 15 20 10 15 5 10 15 160 180 Compensation 160 180 Compensation 160 180 Compensation Histogram A Histogram B Histogram C (b) Describe the shape of the histogram. O The distribution is symmetric. O The distribution is skewed to the left. O The distribution is skewed to the right. (c) Identify any unusual values. (Round your answers to 2 decimal places.) Unusual values million million Percent Percent Percentarrow_forward
- A researcher hypothesizes that ambient air carbon monoxide pollution levels at a certain location should be higher in the winter than they are in the summer. The reasoning behind this hypothesis is that a major source of carbon monoxide in the air is from the incomplete combustion of fuels, and fuels tend to burn less efficiently at low temperatures. Moreover, it is felt that the stagnant winter air is more likely to trap the pollution. In order to investigate this hypothesis, the data set in DS 9.7.12 is collected which shows the ambient air carbon monoxide pollution levels (parts per million) for ten Sunday mornings in the middle of winter and ten Sunday mornings in the middle of summer.arrow_forwardUse the sample data and confidence level given below to complete parts (a) through (d). In a study of cell phone use and brain hemispheric dominance, an Internet survey was e-mailed to 2444 subjects randomly selected from an online group involved with ears. 1139 surveys were returned. Construct a 95% confidence interval for the proportion of returned surveys. Click the icon to view a table of z scores. a) Find the best point estimate of the population proportion p. (Round to three decimal places as needed.) b) Identify the value of the margin of error E. E= (Round to three decimal places as needed.) c) Construct the confidence interval. (…)arrow_forwardarrow_back_iosarrow_forward_ios
Recommended textbooks for you
- MATLAB: An Introduction with ApplicationsStatisticsISBN:9781119256830Author:Amos GilatPublisher:John Wiley & Sons Inc
 Probability and Statistics for Engineering and th...StatisticsISBN:9781305251809Author:Jay L. DevorePublisher:Cengage Learning
 Statistics for The Behavioral Sciences (MindTap C...StatisticsISBN:9781305504912Author:Frederick J Gravetter, Larry B. WallnauPublisher:Cengage Learning
  Elementary Statistics: Picturing the World (7th E...StatisticsISBN:9780134683416Author:Ron Larson, Betsy FarberPublisher:PEARSON
 The Basic Practice of StatisticsStatisticsISBN:9781319042578Author:David S. Moore, William I. Notz, Michael A. FlignerPublisher:W. H. Freeman
 Introduction to the Practice of StatisticsStatisticsISBN:9781319013387Author:David S. Moore, George P. McCabe, Bruce A. CraigPublisher:W. H. Freeman
MATLAB: An Introduction with Applications
Statistics
ISBN:9781119256830
Author:Amos Gilat
Publisher:John Wiley & Sons Inc
Probability and Statistics for Engineering and th...
Statistics
ISBN:9781305251809
Author:Jay L. Devore
Publisher:Cengage Learning
Statistics for The Behavioral Sciences (MindTap C...
Statistics
ISBN:9781305504912
Author:Frederick J Gravetter, Larry B. Wallnau
Publisher:Cengage Learning
Elementary Statistics: Picturing the World (7th E...
Statistics
ISBN:9780134683416
Author:Ron Larson, Betsy Farber
Publisher:PEARSON
The Basic Practice of Statistics
Statistics
ISBN:9781319042578
Author:David S. Moore, William I. Notz, Michael A. Fligner
Publisher:W. H. Freeman
Introduction to the Practice of Statistics
Statistics
ISBN:9781319013387
Author:David S. Moore, George P. McCabe, Bruce A. Craig
Publisher:W. H. Freeman