S Excess supply or surplus $2.20 $1.80 An above-equilibrium price Equilibrium price A below-equilibrium price $1.40 a $1.20 $1.00 Excess demand or shortage D $0.60 300 400 500 600 700 800 900 Quantity of Gasoline (millions of gallons) P ($ per gallon)
Q: 2. Given below is the market demand and supply for fish in a small town. Quantity demanded (Kilos…
A: Demand Curve: - demand curve is the graphical way of showing the relationship between the quantity…
Q: Figure 1 2- a) What are the equilibrium price and equilibrium quantity in the market illustrated by…
A: Equilibrium is at intersection of demand and supply curves. If actual price > equilibrium price,…
Q: Price per Ice-cream (Rs.) Demand for Ice cream (Qd) Supply for Ice cream (Qs) 140…
A: The demand and supply schedule is given as follows- Price per Ice-cream (Rs.)…
Q: 4. Suppose demand and supply for eggs are given by the following equation: Qd = 100-20P Qs = 10 at…
A: Given; Qd=100-2PQs=10+40Pwhere;Qd=number of eggs purchased yearlyQs=number of eggs farms would sell…
Q: Refer to the following supply and demand schedules for the market for yo-yos. Price Qd Qs $1 $2 $3…
A: Equilibrium reaches at a point where demand is equal to supply.
Q: Now suppose that a political crisis in the Middle East lead to a decrease in the supply of petrol by…
A: The economics as a study is based upon the basic idea that the economies tend to have a limit to the…
Q: Given the following two equations: Qd…
A: You have asked multiple questions. We will answer the first question for you. If u want any specific…
Q: Suppose the graph below represents the demand and supply for rice at various prices, answer the…
A: The shortage or surplus is calculated by subtracting quantity demanded from quantity supplied. The…
Q: Suppose that in the citrus market, while the amount of production decreased due to cold winter…
A: A market is a place where the buyers and sellers interact with each other and the exchange of goods…
Q: Can you help me with the question below? In Figure 1, suppose the marginal value for gasoline falls…
A: Marginal value is the value gained foe either consuming or producing one additional good or…
Q: Referring to the figure beloW, suppose the government raises the price of dairy products above the…
A: The equilibrium price is the only one at which the quantity requested and supplied are equal. The…
Q: Suppose demand and supply for eggs are given by the following equation: Qd = 100-20P Qs = 10 +40P…
A: Market equilibrium is that point where quantity demanded is equal to quantity supplied.
Q: Assume the market for corn is depicted as in the tablethat appears below.a. Complete the table…
A: Since you have posted a question with multiple sub-parts, we will solve first three sub-parts for…
Q: Market researches have studied the market for milk,and their estimates for the supply of and the…
A: (a) The equilibrium demand and supply of milk in the economy can be obtained at the point of…
Q: In the market for automobiles, firms in the industry are able to buy the steel for the cars at a…
A: Demand curve is a depiction of consumer behavior /demand at certain level of prices . It is an…
Q: Refer to the table below. a. What is the equilibrium price in this market? 2$ per bushel At what…
A: Equilibrium refers to the situation where the demand and supply of goods is equal. The price at this…
Q: Suppose that when milk sells for $4.50 per gallon, the quantity of milk demanded is 3,250 gallons…
A: Selling price of milk= $4.50 Quantity demanded=3250 Quantity supplied=3860
Q: Which of the following will cause a decrease in market equilibrium price and an increase in…
A: An increase in supply, all other things remain unchanged, will causes the equilibrium price to fall…
Q: 1. Given the following data, identify the amount of shortage or surplus that would exist at a price…
A: Market refers to the place where the goods and services are brought and sold at the common price in…
Q: Consider the market for gasoline, illustrated in the figure to the right. 5.00- S The equilibrium…
A: As shown in the diagram the downward sloping curve D is the demand curve of gasoline and upward…
Q: What if the information regarding market demand and market supply is conveyed in equations rather…
A: Demand curve shows different combinations of price and quantity demanded and supply curve shows…
Q: The table below shows the demand and supply schedules for bleach. PRICE (per litre) QUANTITY…
A: NOTE: Since we only answer up to 3 sub-parts, we’ll answer the first 3. Please resubmit the question…
Q: Imagine that a dairy farmer is willing to provide milk to the market on the basis of the supply…
A: Supply curve shows different combinations of quantity supplied and prices. Subsidy increases…
Q: PA a. On the graph, demonstrate the effect of a $1 tax on equilibrium quantity and equilibrium…
A: As the tax affects supply, the supply curve tends to shift upward, thus establishing the new…
Q: c. How big is the surplus or shortage at $3.40? There is a (Click to select) ]thousand bushels. How…
A: As quantity demanded is higher than quantity supplied, it would result in shortage. As quantity…
Q: Direction: Fill in the blanks to complete the statement using the Market Equilibrium Graph below as…
A: (Since you have asked multiple questions, we will solve the first question for you. If you want any…
Q: Cups of Coffee $6 $5 $4 $3 Demand $2 Osupply $1 $0 Quantity 1. According to the graph above, what is…
A: We have given the demand and supply curve of coffee cups. At a given price, if quantity demand is…
Q: because gas would have been affordable. p. $ per gallon· O E. resulted in a shortage because…
A: The equilibrium is achieved at intersection of demand and supply curve. As the hurricane Katrina…
Q: Many consumer items eventually go out of style, and because fewer people want these items, demand…
A: Explanation:- When suррly аnd demаnd bоth deсreаses, quаntity deсreаses аnd рriсe is…
Q: Assume that supply decreases greatly and demand decreases slightly. Which of the following will…
A: A market is a place where the buyers and the sellers interacts with each other and the exchange of…
Q: Suppose that a new scientific study is published that demonstrates that eating apples slows aging.…
A: A scientific study is published that demonstrates that eating apples slows aging. This will increase…
Q: Consider the restaurant Jack in the Box. As a student, you visit Jack in the Box every week. After…
A: Inferior goods are the goods that have a lower price in the market and are demanded by the people in…
Q: Suppose the total demand for wheat and the total supply of wheat per month in the Kansas City grain…
A: Demand represents the volume of goods and services that the consumers are willing to buy at…
Q: Let's assume that each person in the U.S consumes an average of 37 gallons of soft drinks(nondiet)…
A: Introduction: Many individuals require or desire this. Her concert tickets are in high demand all…
Q: Exercise 2 Sketch the demand and supply curve to show the change in equilibrium price & quantity…
A: a) In case of normal good A normal good is a sort of good that sees an increase in demand as income…
Q: Assume the following data describe the gasoline market: $3.50 $3.25 $3.00 $2.75 | S2.50 | $2.25…
A: Note:- Since we can only answer up to three subparts, we'll answer the first three. Please repost…
Q: Calculate the equilibrium price and the equilibrium quantity. Show all your work.
A: Since you have asked multiple questions, we will solve the first question for you. If you want any…
Q: Suppose the demand curve and supply curve for eggs in the United States are given by the following…
A: Equilibrium quantity and price are determined where market demand and market supply are equal in the…
Q: demand for a 50-lbs bag of nitrogen T fertilizer is Pd = 150-8*Q, where Pd is the consumer's price…
A: Disclaimer :- since you posted multipart question we are solving first 3 subparts as per guidelines…
Q: hen the magnitude of a decrease in supply is greater than the magnitude of a decrease in demand
A: Since you have asked multiple question, we will solve the first question for you. If you want any…
Q: Suppose that in the rice market demand shifts greatly due to a new rice diet that is being marketed…
A: Before the Shifting in the both curves, the equilibrium is obtained at point E1, where supply curve…
Q: If equilibrium price increases while equilibrium quantity decreases, then we know that: market…
A: Equilibrium is the state of rest from where there is no tendency to change further. In a market,…
Q: Table 1 below sets out the demand and supply schedules for milk. Price (ringgit per cartoon)…
A: The equilibrium price and equilibrium quantity of a good sold in the market are determined by the…
Q: Solve the attachment
A: Hello. Since you have posted multiple parts of the question and not specified which part of the…
Q: Which of the following statements about equilibrium price are true? Choose all that apply. A.…
A: The point at which demand for a product equals supply is known as equilibrium. This indicates that…
Q: Price per Ice-cream (Rs.) Demand for Ice cream (Qd) Supply for Ice- cream (Qs) 140…
A: Hi, thanks for these questions. It can be answered up to 3 questions at a time. If you need more to…
Review Figure 3.4. Suppose the price of gasoline is $1.60 per gallon. Is the quantity demanded higher or lower
than at the
in the market? If so, how much?
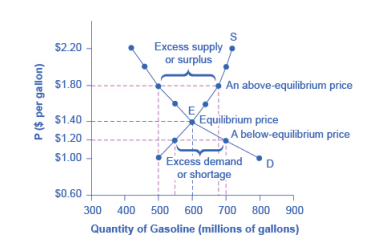
Trending now
This is a popular solution!
Step by step
Solved in 2 steps
- 12LGjjfiV9KIUa7A14QC7gvvPrKFtW6ZwP60WrVE/edit AP 100% PRICE Dolars perp Answer Price ($) 10. Using the graph below, determine the equilibrium price and quantity of pens. 0000 5000- 3000 2000- Normal text Answer: RUBRIC Worksheet 2 Scenario 11. Using the graph below, determine the approximate equilibrium price and quantity of soap. Supety 3 QUANTITY ons of pens) Demand Curve Arial Supply Curve Cartoon P Quantity Supplied Price determination AND PRICE 11 Demand + B I UA Aimg' (a If po increases, what happens to the demand and supply of public transportation (shifts left/shifts right/doesn’t change) What happens to the equilibrium quantity and price for public transportation? (increase/decrease) (b)At a given price p, as oil becomes more expensive (po increases), does the (own) price elasticity of demand for public transportation increase / decrease / stay the same? (c) Calculate the cross-price elasticity of public transportation demand with respect to the oil price po, at the point p = 1 and po = 2. Are the two goods (public transportation and oil) substitutes or complements, or unrelated?PRICE (Yen per gram) 100 90 80 70 60 40 30 20 10 0 0 0 Demand + 20 40 60 80 100 120 140 160 180 200 QUANTITY (grams of uff per month) Graph Input Tool Demand for Uff Price of Uff (Yen per gram) to eat my uff this morning, but there wasn't any Quantity Demanded DEMAND SHIFTERS Average Income -(Yen per month) Price of Tulg (Yen per gram) Price of Snick (Yen per gram) Of Suppose that the price of a gram of uff decreased from 50 yen to 40 yen. This would cause a an increase in 50 100 100 20 50 Plug any value lower than the current number into the Average Income box. A decrease in average income causes a leftward the demand curve. the demand curve and therefore When the prices of tulg or snick change, there is a shift of the demand curve for uff. The directions of these changes imply that snick and uff are , and that tulg and uff are . For example, a Hermetian might say, "I went in my fridge. So instead of having uff for breakfast, I ate some
- A D1 Quantity (per day) Suppose the demand curve shifts to the right and the supply curve shifts to the Right by more than the demand curve. The new demand curve will be upward sloping v and the new supply curve will be downward sloping vDODODO DDO 41% 7:45 PM MSA assignme.. Q Assigument 2 1. The graph below shows the demand curve of two goods by an individual, use the information in the graph to answer the questions that follows; Price GH¢30.00 GHe 25.00 D 0. 2000 2500 3000 Quantity (gallons per day) (a) Calculate the price elasticity of demand for the demand curve, Di. from point A to point C, and the price elasticity of demand for D2 from point A to point B. which demand curve is more elastic, Di or D2? Briefly explain your answer. (b) Given the expenditure function as e(p.q)=pq where p is the price and q is quantity demand. Suppose the individual was purchasing 2000 gallons per day at a price of GHe 30.00 per gallon and the price is cut to GHe25.00 per gallon. calculate tihe change in total expenditure if the demand curve of thc individual is Di? What will be the change in total expenditure if demand is D2? 2. Discuss any four factors that would cause an increase in demand of petroleum engineering program in…Time Income (Y) Quantity (Q) 2017 1500 35 2018 2000 25 Calculate income elasticity?
- an Layout References Mailings Review View Help CA ..A following questions. Quantity Demanded (bushels) 40,000 Price per bushel (in $) Quantity Supplied (bushels) 2 4 36,000 4,000 6. 30,000 24,000 8,000 16,000 10 20,000 20,000 28,000 36,000 40,000 12 18,000 14 12,000 16 6,000 a) What are the equilibrium price and quantity of wheat? Answer: the equilibrium price is $10, and quantity of wheat is $2000 bushels. b) Suppose the prevailing price is US$12 per bushel. Is there a shortage or a surplus in the market? Answer: c) What is the quantity of the shortage or surplus? Answer: d) How many bushels will be sold if the market price is US$4 per bushel? Answer: ited States) B Focus REDMI NOTE 9 AI QUAD CAMERA 144The chart below shows how annual electricity for an average Ontario household would vary with the price paid for electricity. Calculate the arc elasticity of demand for electricity for this average houschold. Also, in the final column, calculate the total revenue from sales of clectricity to this household. Price Quantity Demanded Kwh/year Total Revenue $/kwh Elasticity of Demand $0.25 1200 -0.36 $0.20 1300 $0.15 1400 $0.10 1500 $0.05 1600 Hint: The own price elasticity of demand is the percentage change in the quantity demanded divided by the percentage change in the price. What factors do you think influence the elasticity of demand for this household?The table provides information for the quantity demanded of a product at different income levels. Calculate Income elasticity of demand. Interpret the results. Yearly Income Quantity demanded, units /year 30000 1200 36000 1100