
MATLAB: An Introduction with Applications
6th Edition
ISBN: 9781119256830
Author: Amos Gilat
Publisher: John Wiley & Sons Inc
expand_more
expand_more
format_list_bulleted
Related questions
Question
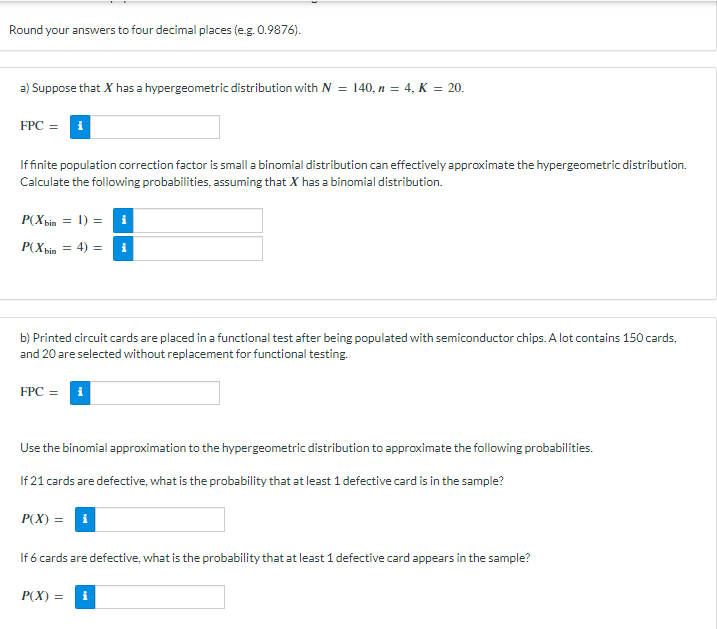

Transcribed Image Text:Round your answers to four decimal places (e.g. 0.9876).
a) Suppose that X has a hypergeometric distribution with N = 140, n = 4, K = 20.
FPC = i
If finite population correction factor is small a binomial distribution can effectively approximate the hypergeometric distribution.
Calculate the following probabilities, assuming that X has a binomial distribution.
P(Xbin = 1) = i
P(Xbin = 4) =
b) Printed circuit cards are placed in a functional test after being populated with semiconductor chips. A lot contains 150 cards,
and 20 are selected without replacement for functional testing.
FPC = i
Use the binomial approximation to the hypergeometric distribution to approximate the following probabilities.
If 21 cards are defective, what is the probability that at least 1 defective card is in the sample?
P(X) = i
If 6 cards are defective, what is the probability that at least 1 defective card appears in the sample?
P(X) = i
Expert Solution
This question has been solved!
Explore an expertly crafted, step-by-step solution for a thorough understanding of key concepts.

This is a popular solution

Trending nowThis is a popular solution!

Step by stepSolved in 5 steps

Knowledge Booster

Similar questions
- A Poisson distribution with λ =7.4 λ =7.4 and x=5Use the probability distribution identified above to calculate the following:arrow_forwardAssume that we have two normal distributions both with means 0 and standard deviations σ1 and σ2. If σ1 ≥ σ2, then which of P (0 ≤ x ≤ σ1) and P (0 ≤ x ≤ σ2) is bigger? Explain your answer.arrow_forwardAssume the random variable X is normally distributed with mean μ=50 and standard deviation σ=7. Compute the probability. Be sure to draw a normal curve with the area corresponding to the probability shaded. P(X>36) Which of the following normal curves corresponds to P(X>36)? A. 36 50 A normal curve has a horizontal axis with two labeled coordinates, 36 and 50. The curve's peak is near the top of the graph at horizontal coordinate 50. Two vertical line segments run from the horizontal axis to the curve at horizontal coordinates 36 and 50. The area under the curve between the vertical line segments is shaded. B. 36 50 A normal curve has a horizontal axis with two labeled coordinates, 36 and 50. The curve's peak is near the top of the graph at horizontal coordinate 50. Two vertical line segments run from the horizontal axis to the curve at horizontal coordinates 36 and 50. The area…arrow_forward
- Assume that a procedure yields a binomial distribution with n=58n=58 trials and the probability of success for one trial is p=23%p=23%.Find the mean for this binomial distribution.(Round answer to one decimal place.)μ=μ= Find the standard deviation for this distribution.(Round answer to two decimal places.)σ=σ= Use the range rule of thumb to find the minimum usual value μ–2σ and the maximum usual value μ+2σ.Enter answer as an interval using square-brackets only with whole numbers.usual values =arrow_forward6 times. Use either Assume that a procedure yields a binomial distribution with a trial repeated n = the binomial probability formula (or a technology like Excel or StatDisk) to find the probability of k = 0 successes given the probability q = 0.59 of success on a single trial. (Report answer accurate to 4 decimal places.) P(X = k) =arrow_forwardPage 348 5.3.14arrow_forward
- Assume that a procedure yields a binomial distribution with a trial repeated n=14 times. Use either the binomial probability formula (or a technology like Excel or StatDisk) to find the probability of k=11 successes given the probability p=0.66 of success on a single trial.(Report answer accurate to 4 decimal places.)P(X=k)=arrow_forwardAssume that a procedure yields a binomial distribution with n=1222n=1222 trials and the probability of success for one trial is p=38%p=38%.Find the mean for this binomial distribution.(Round answer to one decimal place.)μ=μ= Find the standard deviation for this distribution.(Round answer to two decimal places.)σ=σ= Use the range rule of thumb to find the minimum usual value μ–2σ and the maximum usual value μ+2σ.Enter answer as an interval using square-brackets only with whole numbers.usual values =arrow_forward1. Let XX represent the full height of a certain species of tree. Assume that XX has a normal probability distribution with a mean of 231.1 ft and a standard deviation of 5.6 ft.A tree of this type grows in my backyard, and it stands 230 feet tall. Find the probability that the height of a randomly selected tree is as tall as mine or shorter.P(X<230) = Enter your answer accurate to 4 decimal places. 2. Assume that z-scores are normally distributed with a mean of 0 and a standard deviation of 1.If P(−0.7<z<b)=0.7352P find b.b= (Round to two decimal places.) Do not round until the very last step. Any intermediate steps should include all decimal places.arrow_forward
- The lifetime of a certain residential air conditioner is normally distributed with a mean of 20 years and a standard deviation of 2 years. Find the probability that if one of these air conditioners is randomly selected, it will last between 19 years and 19.5 years. DII 00.093 O 0.401 00.309 00.290 O None of these Submit Question 4 R V F4 % 5 T G F5 6 Y H N F6 & 7 J 8 M PrtScn K O Home 9 End 0 F10 Parrow_forward6.2/3arrow_forwardAssume that a procedure yields a binomial distribution with n=1231n=1231 trials and the probability of success for one trial is p=0.77p=0.77.Find the mean for this binomial distribution.(Round answer to one decimal place.) μ = Find the standard deviation for this distribution.(Round answer to two decimal places.) σ = Use the range rule of thumb to find the minimum usual value μ–2σ and the maximum usual value μ+2σ.Enter the answer as an interval using square-brackets only with whole numbers. usual values =arrow_forward
arrow_back_ios
arrow_forward_ios
Recommended textbooks for you
- MATLAB: An Introduction with ApplicationsStatisticsISBN:9781119256830Author:Amos GilatPublisher:John Wiley & Sons Inc
 Probability and Statistics for Engineering and th...StatisticsISBN:9781305251809Author:Jay L. DevorePublisher:Cengage Learning
 Statistics for The Behavioral Sciences (MindTap C...StatisticsISBN:9781305504912Author:Frederick J Gravetter, Larry B. WallnauPublisher:Cengage Learning
  Elementary Statistics: Picturing the World (7th E...StatisticsISBN:9780134683416Author:Ron Larson, Betsy FarberPublisher:PEARSON
 The Basic Practice of StatisticsStatisticsISBN:9781319042578Author:David S. Moore, William I. Notz, Michael A. FlignerPublisher:W. H. Freeman
 Introduction to the Practice of StatisticsStatisticsISBN:9781319013387Author:David S. Moore, George P. McCabe, Bruce A. CraigPublisher:W. H. Freeman
MATLAB: An Introduction with Applications
Statistics
ISBN:9781119256830
Author:Amos Gilat
Publisher:John Wiley & Sons Inc
Probability and Statistics for Engineering and th...
Statistics
ISBN:9781305251809
Author:Jay L. Devore
Publisher:Cengage Learning
Statistics for The Behavioral Sciences (MindTap C...
Statistics
ISBN:9781305504912
Author:Frederick J Gravetter, Larry B. Wallnau
Publisher:Cengage Learning
Elementary Statistics: Picturing the World (7th E...
Statistics
ISBN:9780134683416
Author:Ron Larson, Betsy Farber
Publisher:PEARSON
The Basic Practice of Statistics
Statistics
ISBN:9781319042578
Author:David S. Moore, William I. Notz, Michael A. Fligner
Publisher:W. H. Freeman
Introduction to the Practice of Statistics
Statistics
ISBN:9781319013387
Author:David S. Moore, George P. McCabe, Bruce A. Craig
Publisher:W. H. Freeman