
MATLAB: An Introduction with Applications
6th Edition
ISBN: 9781119256830
Author: Amos Gilat
Publisher: John Wiley & Sons Inc
expand_more
expand_more
format_list_bulleted
Related questions
Question
Solve for E
the
and standard deviation is 101.6
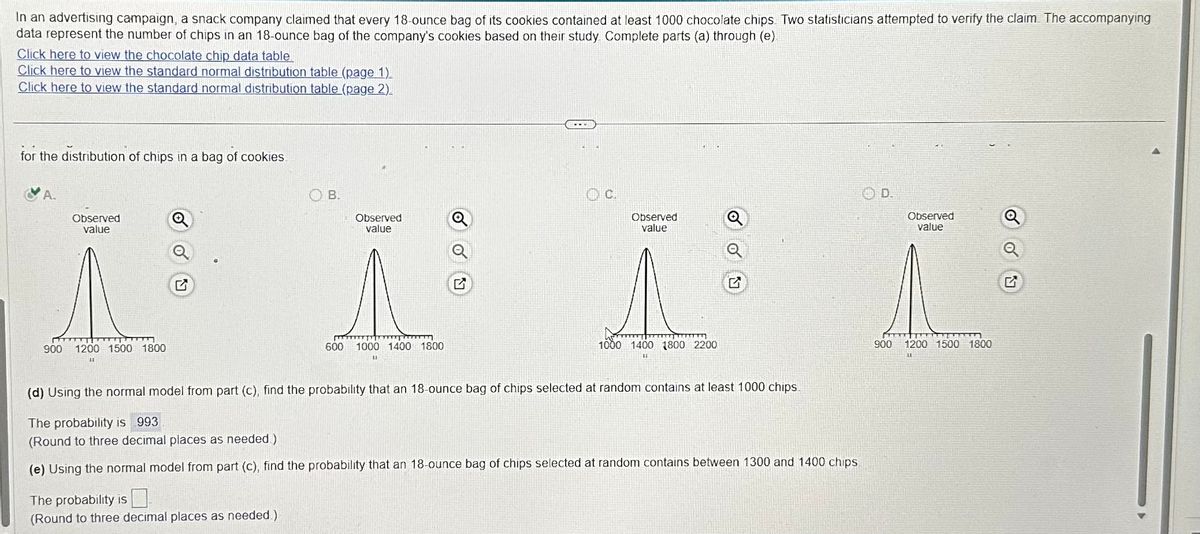

Transcribed Image Text:In an advertising campaign, a snack company claimed that every 18-ounce bag of its cookies contained at least 1000 chocolate chips. Two statisticians attempted to verify the claim. The accompanying
data represent the number of chips in an 18-ounce bag of the company's cookies based on their study Complete parts (a) through (e)
Click here to view the chocolate chip data table.
Click here to view the standard normal distribution table (page 1)_
Click here to view the standard normal distribution table (page 2).
for the distribution of chips in a bag of cookies.
A.
900
Observed
value
T
1200 1500 1800
B.
The probability is
(Round to three decimal places as needed)
600
Observed
value
1000 1400 1800
Observed
value
1000 1400 1800 2200
(d) Using the normal model from part (c), find the probability that an 18-ounce bag of chips selected at random contains at least 1000 chips.
The probability is 993
(Round to three decimal places as needed)
(e) Using the normal model from part (c), find the probability that an 18-ounce bag of chips selected at random contains between 1300 and 1400 chips
D.
Observed
value
FARE HUA
900 1200 1500 1800

Transcribed Image Text:Chocolate Chip Data Table
1083
1097
1102
1118
1131
1136
1137
1139
1156
1164
1182
1187
1197
1202
1213
1216
1217
1218
1221
1232
1239
1244
1247
1254
1266
1275
1277
1292
1292
1294
1302
1323
1348
1359
1359
1378
1400
1416
1444
1518
1
I
Expert Solution
This question has been solved!
Explore an expertly crafted, step-by-step solution for a thorough understanding of key concepts.

This is a popular solution

Trending nowThis is a popular solution!

Step by stepSolved in 3 steps with 5 images

Knowledge Booster

Similar questions
- A company produces steel rods. The lengths of the steel rods are normally distributed with a mean of 241.2-cm and a standard deviation of 0.6-cm.Find P22, which is the length separating the shortest 22% rods from the longest 78%.P22 =arrow_forwardGiven the sample data {1, 1, 3, 4, 6}.Calculate the mean.Calculate the standard deviation.arrow_forwardA population has a mean u = 87 and a standard deviation o = 28. Find the mean and standard deviatio sample sizen=49. =(Simplify your answer.) (Simplify your answer.) Enter your answer in each of the answer boxes. ch %3Darrow_forward
- open file attached for questionarrow_forwardFind the mean and standard deviation of the number of red-headed Scots in a randomly selected group of 155. The probability of having red hair is still 13% for Scottish people. a. Mean = b. Standard deviation (Round to 2 places)=arrow_forwardHigh-rent district: The mean monthly rent for a one-bedroom apartment without a doorman in Manhattan is $2550. Assume the standard deviation is $485. A real estate firm samples 85 apartments. Use Excel.arrow_forward
- A city took a survey of 1,550 households to find out how many televisions each owned. The mean was 2.1 televisions, with a standard deviation of 1.7. What should the researchers do to decrease the margin of error? Answer in complete sentences. UPLOAD WRITER C2arrow_forwardThe speed vehicles traveled on a local highway was recorded for one month. The speeds ranged from 47 mph to 62 mph with a mean speed of 55 mph and a standard deviation of 6 mph. The quartiles and median speeds were 50 mph, 59 mph, and 52 mph. Suppose increased patrols reduced speeds by 7%. Find the new mean and standard deviation. Express your answer in exact decimals. Choose the best answer below: A. Mean: 3.85 mph, SD: 0.42 mph B. Mean: 58.85 mph, SD: 6.42 mph C. Mean: 51.15 mph, SD: 6 mph D. Mean: 58.85 mph, SD: 6 mph E. Mean: 51.15 mph, SD: 5.58 mpharrow_forwardFind the range, the standard deviation, and the variance for the given samples. Round noninteger results to the nearest tenth. 91, 78, 89, 70, 90, 75, 84, 98, 96, 79, 77 range standard deviation variancearrow_forward
- TLe Citu University of 3. Find the standard deviation for the following sample data: Freq. 6. 7 8. 8. 1 6. 10 4 3.arrow_forwardz Scores LeBron James, one of the most successful basketball players of all time, has a height of 6 feet 8 inches, or 203 cm. Based on statistics from Data Set 1 “Body Data” in Appendix B, his height converts to the z score of 4.07. How many standard deviations is his height above the mean?arrow_forward
arrow_back_ios
arrow_forward_ios
Recommended textbooks for you
- MATLAB: An Introduction with ApplicationsStatisticsISBN:9781119256830Author:Amos GilatPublisher:John Wiley & Sons Inc
 Probability and Statistics for Engineering and th...StatisticsISBN:9781305251809Author:Jay L. DevorePublisher:Cengage Learning
 Statistics for The Behavioral Sciences (MindTap C...StatisticsISBN:9781305504912Author:Frederick J Gravetter, Larry B. WallnauPublisher:Cengage Learning
  Elementary Statistics: Picturing the World (7th E...StatisticsISBN:9780134683416Author:Ron Larson, Betsy FarberPublisher:PEARSON
 The Basic Practice of StatisticsStatisticsISBN:9781319042578Author:David S. Moore, William I. Notz, Michael A. FlignerPublisher:W. H. Freeman
 Introduction to the Practice of StatisticsStatisticsISBN:9781319013387Author:David S. Moore, George P. McCabe, Bruce A. CraigPublisher:W. H. Freeman
MATLAB: An Introduction with Applications
Statistics
ISBN:9781119256830
Author:Amos Gilat
Publisher:John Wiley & Sons Inc
Probability and Statistics for Engineering and th...
Statistics
ISBN:9781305251809
Author:Jay L. Devore
Publisher:Cengage Learning
Statistics for The Behavioral Sciences (MindTap C...
Statistics
ISBN:9781305504912
Author:Frederick J Gravetter, Larry B. Wallnau
Publisher:Cengage Learning
Elementary Statistics: Picturing the World (7th E...
Statistics
ISBN:9780134683416
Author:Ron Larson, Betsy Farber
Publisher:PEARSON
The Basic Practice of Statistics
Statistics
ISBN:9781319042578
Author:David S. Moore, William I. Notz, Michael A. Fligner
Publisher:W. H. Freeman
Introduction to the Practice of Statistics
Statistics
ISBN:9781319013387
Author:David S. Moore, George P. McCabe, Bruce A. Craig
Publisher:W. H. Freeman