
MATLAB: An Introduction with Applications
6th Edition
ISBN: 9781119256830
Author: Amos Gilat
Publisher: John Wiley & Sons Inc
expand_more
expand_more
format_list_bulleted
Related questions
Question
A rocket motor is manufactured by bonding together two types of propellants, an igniter and a sustainer. The shear strength of the bond y is thought to be a linear
| Obs. No. | Strength (psi) y | Age (weeks) x | Obs. No. | Strength (psi) y | Age (weeks) x |
| 1 | 2172.10 | 15.50 | 11 | 2178.00 | 11.50 | |
| 2 | 1,678.15 | 23.75 | 12 | 2,399.55 | 3.75 | |
| 3 | 2,316.00 | 8.00 | 13 | 1,779.80 | 25.00 | |
| 4 | 2,061.30 | 17.00 | 14 | 2,336.75 | 9.75 | |
| 5 | 2,207.50 | 5.00 | 15 | 1,765.30 | 22.0 | |
| 6 | 1,708.30 | 19.00 | 16 | 2,053.50 | 18.00 | |
| 7 | 1,784.70 | 24.00 | 17 | 2,414.40 | 6.00 | |
| 8 | 2,575.00 | 2.50 | 18 | 2,200.50 | 12.50 | |
| 9 | 2,357.90 | 7.50 | 19 | 2,654.20 | 2.00 | |
| 10 | 2,277.70 | 11.00 | 20 | 1,753.70 | 21.50 |
Need to find t0
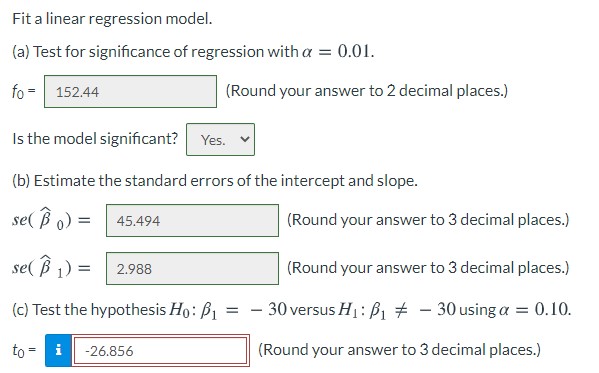

Transcribed Image Text:Fit a linear regression model.
(a) Test for significance of regression with a = 0.01.
fo =
152.44
(Round your answer to 2 decimal places.)
Is the model significant? Yes.
(b) Estimate the standard errors of the intercept and slope.
se( B o) =
45.494
(Round your answer to 3 decimal places.)
se( B 1) =
(Round your answer to 3 decimal places.)
2.988
%3D
(c) Test the hypothesis Ho: B1
30 versus H1: B1 # - 30 using a = 0.10.
%3D
to=
i
-26.856
(Round your answer to 3 decimal places.)
Expert Solution
This question has been solved!
Explore an expertly crafted, step-by-step solution for a thorough understanding of key concepts.

This is a popular solution

Trending nowThis is a popular solution!

Step by stepSolved in 3 steps with 2 images

Knowledge Booster

Similar questions
- 3.27 The topographic map of a region is shown below. 5 4.5 NIONU OOJU 3.5 204 3 2.5 2.9996 2.7269 2.4542 2.1815 1.9088 1.6362 1.3635 1.5 0. 1 0. 546 38 0.5 Find the directional derivative at (1,1) in the direction toward the point (3,2). Round your answer to 2 decimal places. I Clearly state how you made the estimation. .8177 2.1542 E2.18188 1.306361 - 1.3635 - 1.0908 - 0,81807 - - 0.54538 - 0.27269arrow_forwardThe following Minitab display gives information regarding the relationship between the body weight of a child (in kilograms) and the metabolic rate of the child (in 100 kcal/ 24 hr). Predictor Coef SE Coef T P Constant 0.8489 0.4148 2.06 0.84 Weight 0.39782 0.02978 13.52 0.000 S = 0.517508 R-Sq = 96.6% (a) Write out the least-squares equation. = + x (b) For each 1 kilogram increase in weight, how much does the metabolic rate of a child increase? (Use 5 decimal places.)(c) What is the value of the correlation coefficient r? (Use 3 decimal places.)arrow_forwardew urrent Attempt in Progress A manager wishes to predict the annual cost (y) of an automobile based on the nur was developed: y = 1,550 +0.36x. If a car is driven 30,000 kilometres, the predicte O 12,350 O 2,630 O 10,800 O 10,250 0 9,250arrow_forward
- In a regression analysis involving 30 observations, the following estimated regression equation was obtained. ŷ = 18.6 + 3.7x, - 2.2x2 + 7.9x3 + 2.6x4 (a) Interpret b, in this estimated regression equation. = 3.7 is an estimate of the change in y corresponding to a 1 unit change in x, when x,, x3, and x, are held constant. = -2.2 is an estimate of the change in y corresponding to a 1 unit change in x, when x2, x3, and x are held constant. O b1 = 7.9 is an estimate of the change in y corresponding to a1 unit change in x, when x,, x2, and x, are held constant. O b, O b, = 3.7 is an estimate of the change in y corresponding to a 1 unit change in x, = 2.6 is an estimate of the change in y corresponding to a 1 unit change in x, when x,, x2, and x3 are held constant. when and x4 are held constant. Interpret b, in this estimated regression equation. O b2 = 2.6 is an estimate of the change in y corresponding to a 1 unit change in x, when x,, x2, and x, are held constant. = 7.9 is an estimate…arrow_forwardIf we want to find a range of values for which a possible population average would be, we would use O t-test O z-test confidence interval for u confidence interval for Parrow_forward. At wind speeds above 1000 cm/sec, significant sand–moving events begin to occur. Wind speeds below 1000 cm/sec deposit sand and wind speeds above 1000 cm/sec move sand to new locations. The cyclic nature of wind and moving sand determines the shape and location of large dunes. At a test site, the prevailing direction of the wind did not change noticeably. However, the velocity did change. 75 wind speed readings gave an average velocity of x =1045 cm/sec. Based on long–term experience, can be assumed to be 240 cm/sec Find a 99% confidence interval for the population mean wind speed at this site. (Round your answers to the nearest whole number) (DO A MANUAL CALCULATION, SHOWING ALL WORK INCLUDING THE EQUATION USED AND THEN WITH ALL VALUES PLUGGED INTO THE EQUATION)(SHOW WORK ABOVE) [final answer] Margin of Error: E = (value with units)[final answer] Confidence Interval : _________________ < __________________ < __________________ (value with units) (correct symbol) (value with…arrow_forward
arrow_back_ios
arrow_forward_ios
Recommended textbooks for you
- MATLAB: An Introduction with ApplicationsStatisticsISBN:9781119256830Author:Amos GilatPublisher:John Wiley & Sons Inc
 Probability and Statistics for Engineering and th...StatisticsISBN:9781305251809Author:Jay L. DevorePublisher:Cengage Learning
 Statistics for The Behavioral Sciences (MindTap C...StatisticsISBN:9781305504912Author:Frederick J Gravetter, Larry B. WallnauPublisher:Cengage Learning
  Elementary Statistics: Picturing the World (7th E...StatisticsISBN:9780134683416Author:Ron Larson, Betsy FarberPublisher:PEARSON
 The Basic Practice of StatisticsStatisticsISBN:9781319042578Author:David S. Moore, William I. Notz, Michael A. FlignerPublisher:W. H. Freeman
 Introduction to the Practice of StatisticsStatisticsISBN:9781319013387Author:David S. Moore, George P. McCabe, Bruce A. CraigPublisher:W. H. Freeman
MATLAB: An Introduction with Applications
Statistics
ISBN:9781119256830
Author:Amos Gilat
Publisher:John Wiley & Sons Inc
Probability and Statistics for Engineering and th...
Statistics
ISBN:9781305251809
Author:Jay L. Devore
Publisher:Cengage Learning
Statistics for The Behavioral Sciences (MindTap C...
Statistics
ISBN:9781305504912
Author:Frederick J Gravetter, Larry B. Wallnau
Publisher:Cengage Learning
Elementary Statistics: Picturing the World (7th E...
Statistics
ISBN:9780134683416
Author:Ron Larson, Betsy Farber
Publisher:PEARSON
The Basic Practice of Statistics
Statistics
ISBN:9781319042578
Author:David S. Moore, William I. Notz, Michael A. Fligner
Publisher:W. H. Freeman
Introduction to the Practice of Statistics
Statistics
ISBN:9781319013387
Author:David S. Moore, George P. McCabe, Bruce A. Craig
Publisher:W. H. Freeman