
MATLAB: An Introduction with Applications
6th Edition
ISBN: 9781119256830
Author: Amos Gilat
Publisher: John Wiley & Sons Inc
expand_more
expand_more
format_list_bulleted
Related questions
Question
statistical inference
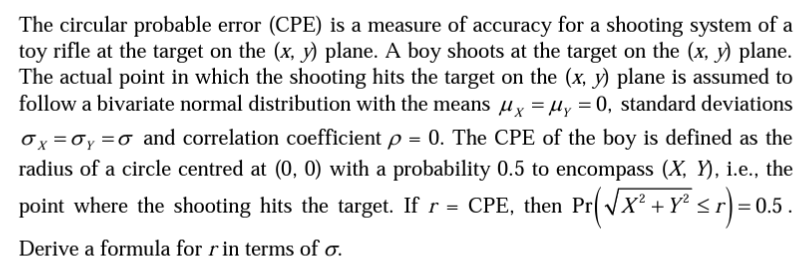

Transcribed Image Text:The circular probable error (CPE) is a measure of accuracy for a shooting system of a
toy rifle at the target on the (x, y) plane. A boy shoots at the target on the (x, y) plane.
The actual point in which the shooting hits the target on the (x, y) plane is assumed to
follow a bivariate normal distribution with the means µx = µy = 0, standard deviations
Ox=0y = 0 and correlation coefficient p = 0. The CPE of the boy is defined as the
radius of a circle centred at (0, 0) with a probability 0.5 to encompass (X, Y), i.e., the
point where the shooting hits the target. If r = CPE, then Pr(√X² + y² ≤r) = 0.5 .
Derive a formula for r in terms of o.
Expert Solution
This question has been solved!
Explore an expertly crafted, step-by-step solution for a thorough understanding of key concepts.

Step by stepSolved in 4 steps with 4 images

Knowledge Booster

Similar questions
- How do you find the maximum likelihood estimator for the exponential distribution?arrow_forwardStatistical Physicsarrow_forwardData on the cost (millions of dollars) and the running time (minutes) for films of a particular season are summarized in the computer output shown to the right and the plots below. Complete parts a and b Click the icon to view the plots. a) Check the assumptions and conditions for inference Select all that apply The residual plot and the scatterplot show consistent variability The scatterplot looks straight enough The residuals look random The residuals are nearly normal None of the assumptions and conditions for inference are satisfied. b) Find a 95% confidence interval for the slope and interpret it. m% confident that the cost of making longer movies (Round to two decimal places as needed. Use ascending order.) Dependent variable is: Budget(SM) squared-24.0% R s 25.12 with 20-2-18 degrees of freedom Variable Coefficient SE(Coeff) t-ratio P-value intercept -23.5882 Run Time 0.665602 0.2788 34.12 -0.69 0.4982 2.39 0.0282 at a rate of between and milion dollars per minute Plots 120 Run…arrow_forward
- ANOVA Tests and Independent & Dependent Variables COLLAPSE How are the treatments in an ANOVA test similar to independent and dependent variables? How are they different?arrow_forwardRegression Methodology – A standard simple linear regression or multiple linear regression is based on “Ordinary Least Squares (OLS)”. Define OLS and what it is. Why do we use OLS for linear regressions? What are limitations of using OLS?arrow_forwardTrue or False? If False, explain: a) The sample is the group of people on whom we wish to draw statistical interference. b) The Mean Square Error from a regression model is an example of a descriptive statistic. c) Getting enough power (so that we are able to conclude a non-zero slope in a scenario where the true slope is non-zero) is achieved primarily by increasing sample size.arrow_forward
arrow_back_ios
arrow_forward_ios
Recommended textbooks for you
- MATLAB: An Introduction with ApplicationsStatisticsISBN:9781119256830Author:Amos GilatPublisher:John Wiley & Sons Inc
 Probability and Statistics for Engineering and th...StatisticsISBN:9781305251809Author:Jay L. DevorePublisher:Cengage Learning
 Statistics for The Behavioral Sciences (MindTap C...StatisticsISBN:9781305504912Author:Frederick J Gravetter, Larry B. WallnauPublisher:Cengage Learning
  Elementary Statistics: Picturing the World (7th E...StatisticsISBN:9780134683416Author:Ron Larson, Betsy FarberPublisher:PEARSON
 The Basic Practice of StatisticsStatisticsISBN:9781319042578Author:David S. Moore, William I. Notz, Michael A. FlignerPublisher:W. H. Freeman
 Introduction to the Practice of StatisticsStatisticsISBN:9781319013387Author:David S. Moore, George P. McCabe, Bruce A. CraigPublisher:W. H. Freeman
MATLAB: An Introduction with Applications
Statistics
ISBN:9781119256830
Author:Amos Gilat
Publisher:John Wiley & Sons Inc
Probability and Statistics for Engineering and th...
Statistics
ISBN:9781305251809
Author:Jay L. Devore
Publisher:Cengage Learning
Statistics for The Behavioral Sciences (MindTap C...
Statistics
ISBN:9781305504912
Author:Frederick J Gravetter, Larry B. Wallnau
Publisher:Cengage Learning
Elementary Statistics: Picturing the World (7th E...
Statistics
ISBN:9780134683416
Author:Ron Larson, Betsy Farber
Publisher:PEARSON
The Basic Practice of Statistics
Statistics
ISBN:9781319042578
Author:David S. Moore, William I. Notz, Michael A. Fligner
Publisher:W. H. Freeman
Introduction to the Practice of Statistics
Statistics
ISBN:9781319013387
Author:David S. Moore, George P. McCabe, Bruce A. Craig
Publisher:W. H. Freeman