
MATLAB: An Introduction with Applications
6th Edition
ISBN: 9781119256830
Author: Amos Gilat
Publisher: John Wiley & Sons Inc
expand_more
expand_more
format_list_bulleted
Related questions
Question
|
Researchers collected samples of water from streams in a mountain
2-Sample t-test of μ1−μ2=0, Difference Between Means=0.195 t-Statistic=5.30 w/125 df, P≤0.0001
a) State the null and alternative hypotheses for this test. Choose the correct answer below.
H0: μM−μS≠0; HA: μM−μS=0
Part 2b) From the information you have, do the assumptions and conditions appear to be met?
Which of the following conditions are satisfied for the given data? Select all that apply.
A. Independent group assumption
Part 3c) What conclusion would you draw?
▼ (Fail to reject/ Reject)
H0. There
▼
(is not/ is) |
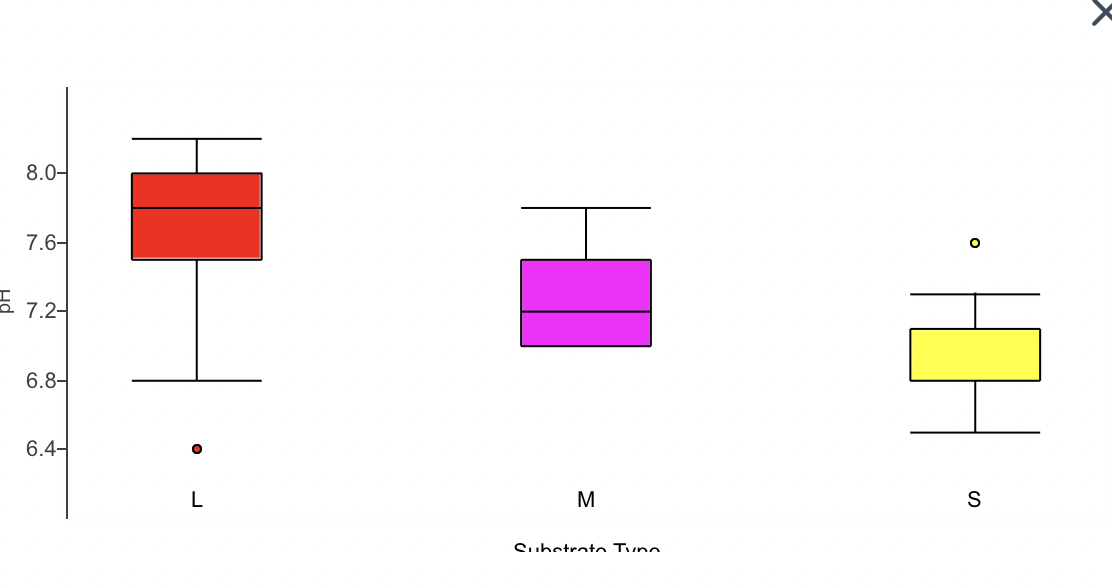

Transcribed Image Text:8.0-
7.6-
는 7.21
6.8-
6.4-
M
Subetroto Tyno
Expert Solution
This question has been solved!
Explore an expertly crafted, step-by-step solution for a thorough understanding of key concepts.

This is a popular solution

Trending nowThis is a popular solution!

Step by stepSolved in 4 steps

Knowledge Booster

Similar questions
- What are the interpretations of the Y intercept and the slopes in a multiple regression model?arrow_forwardPlease helparrow_forwardThe cost of fuel is the largest component of cost of ownership for most vehicles. Fuel cost is (almost) inversely proportional to gas mileage; higher gas mileage means lower fuel cost and vice-versa. If you keep track of the number of miles driven on each tank of gas as well as how much gas is purchased, it is easy to calculate gas mileage; many cell phone apps exist to track this. The data in the following table is the gas mileage for Mr. Hebert's 2015 Jeep Wrangler Unlimited. 12.85 14.98 15.36 17.09 18.86 13.28 15.11 15.62 17.50 19.07 13.48 15.12 15.65 17.66 20.91 14.65 15.13 16.41 18.17 21.17 14.71 15.14 16.80 18.27 22.11 f. Construct a 95% confidence interval to estimate the average fuel economy of the jeep. enter your response here≤μ≤enter your response here (Round your answers to 2 decimal places.)arrow_forward
- A chemistry experiment is performed measuring the solubility of potassium chloride (KCl) in water at different temperatures. The goal was to determine if there is a linear relationship between the temperature of the water and how much KCl can dissolve, measured as grams per 100 milliliter (g/100mL). After the experiments were performed, the following data was collected with temperature being the independent x-variable and solubility being the dependent y-variable: Temperature (°C) x Solubility (g/100mL) y 10 31 20 33 30 37 40 41 50 42 Based on the data given for temperature and solubility of KCl and without doing any math yet, which of the following do you predict would best describe the relationship between these variables? A positive linear relationship (r close to 1) A positive linear relationship (r close to -1) A negative linear relationship (r close to 1) A negative linear relationship (r close to -1)…arrow_forwardThe mtcars data set contains data on 32 cars from the 1974 Motor Trend US magazine. The data set has 11 variables that measure different aspects of the cars, such as miles per gallon (mpg), horsepower (hp), weight (wt), and number of cylinders (cyl). The data set can be used to study the relationship between fuel consumption and car performance, as well as other factors that affect the efficiency and design of the cars. What is the maximum and minimum number of the range regarding the explanatory variable for which the regression model can make valid predictions?arrow_forwardThe cost of fuel is the largest component of cost of ownership for most vehicles. Fuel cost is (almost) inversely proportional to gas mileage; higher gas mileage means lower fuel cost and vice-versa. If you keep track of the number of miles driven on each tank of gas as well as how much gas is purchased, it is easy to calculate gas mileage; many cell phone apps exist to track this. The data in the following table is the gas mileage for Mr. Hebert's 2015 Jeep Wrangler Unlimited. 12.85 14.98 15.36 17.09 18.86 13.28 15.11 15.62 17.50 19.07 13.48 15.12 15.65 17.66 20.91 14.65 15.13 16.41 18.17 21.17 14.71 15.14 16.80 18.27 22.11 c. Find the five number summary. enter your response here, enter your response here, enter your response here, enter your response here, enter your response herearrow_forward
- Suppose a researcher collects data on the air pollution levels, measured in milligrams per cubic meter, for both urban and rural areas in 35 states. The data is plotted with urban air pollution levels on the horizontal axis and rural air pollution levels on the vertical axis. Nevada is an outlier in the ?x‑direction. What must be true about this state? The urban air pollution levels for this state are much higher or lower than the rest of the states in the data set. The rural air pollution levels for this state are much higher or much lower than the rest of the states in the data set. This state is an influential observation. The rural air pollution levels for this state are much higher or lower than other states in the data set that have similar urban air pollution levels. The absolute value of the residual of this state is large.arrow_forwardA financial website reported the beta value for a certain company was 0.86. Betas for individual stocks are determined by simple linear regression. The dependent variable is the total return for the stock, and the independent variable is the total return for the stock market, such as the return of a market index. The slope of this regression equation is referred to as the stock's beta. Many financial analysts prefer to measure the risk of a stock by computing the stock's beta value. Suppose the following data show the monthly percentage returns for the market index and the company for a recent year. Month Market Index% Return Company% Return August -3 4 September 8 7 October 0 1 November -2 1 December -5 0 January 0 0 February 7 7 March 0 -2 April 2 0 May -5 -1 a. Develop the least squares estimated regression equation. (Let x = Market Index % Return (as a %), and let y = Company % Return (as a %). Round your numerical values to four decimal places.)arrow_forwardOcean currents are important in studies of climate change, as well as ecology studies of dispersal of plankton. Drift bottles are used to study ocean currents in the Pacific near Hawaii, the Solomon Islands, New Guinea, and other islands. Let x represent the number of days to recovery of a drift bottle after release and y represent the distance from point of release to point of recovery in km/100. The following data are representative of one study using drift bottles to study ocean currents. x days 75 79 35 91 203 y km/100 14.2 19.1 5.8 11.2 35.4 (a) Verify that Σx = 483, Σy = 85.7, Σx2 = 62,581, Σy2 = 1978.69, Σxy = 10982.3, and r ≈ 0.94895. Σx Σy Σx2 Σy2 Σxy r (b) Use a 1% level of significance to test the claim ρ > 0. (Use 2 decimal places.) t critical t (c) Verify that Se ≈ 4.1118, a ≈ 0.7378, and b ≈ 0.1698. Se a barrow_forward
arrow_back_ios
arrow_forward_ios
Recommended textbooks for you
- MATLAB: An Introduction with ApplicationsStatisticsISBN:9781119256830Author:Amos GilatPublisher:John Wiley & Sons Inc
 Probability and Statistics for Engineering and th...StatisticsISBN:9781305251809Author:Jay L. DevorePublisher:Cengage Learning
 Statistics for The Behavioral Sciences (MindTap C...StatisticsISBN:9781305504912Author:Frederick J Gravetter, Larry B. WallnauPublisher:Cengage Learning
  Elementary Statistics: Picturing the World (7th E...StatisticsISBN:9780134683416Author:Ron Larson, Betsy FarberPublisher:PEARSON
 The Basic Practice of StatisticsStatisticsISBN:9781319042578Author:David S. Moore, William I. Notz, Michael A. FlignerPublisher:W. H. Freeman
 Introduction to the Practice of StatisticsStatisticsISBN:9781319013387Author:David S. Moore, George P. McCabe, Bruce A. CraigPublisher:W. H. Freeman
MATLAB: An Introduction with Applications
Statistics
ISBN:9781119256830
Author:Amos Gilat
Publisher:John Wiley & Sons Inc
Probability and Statistics for Engineering and th...
Statistics
ISBN:9781305251809
Author:Jay L. Devore
Publisher:Cengage Learning
Statistics for The Behavioral Sciences (MindTap C...
Statistics
ISBN:9781305504912
Author:Frederick J Gravetter, Larry B. Wallnau
Publisher:Cengage Learning
Elementary Statistics: Picturing the World (7th E...
Statistics
ISBN:9780134683416
Author:Ron Larson, Betsy Farber
Publisher:PEARSON
The Basic Practice of Statistics
Statistics
ISBN:9781319042578
Author:David S. Moore, William I. Notz, Michael A. Fligner
Publisher:W. H. Freeman
Introduction to the Practice of Statistics
Statistics
ISBN:9781319013387
Author:David S. Moore, George P. McCabe, Bruce A. Craig
Publisher:W. H. Freeman